Data Import test report (Nolana)
- Roman_Fedynyshyn
- Martin Tran
- Olga Kondratenko
- Ann-Marie Breaux (Deactivated)
It's been found after testing that the actual durations of the imports performed were about 2 (two) times longer than what was reported. This is due to the PTF environment missing a DB trigger that, when restored, doubled the imports' durations.
Overview
This document contains the results of testing Data Import for MARC Bibliographic records in the Nolana release to detect performance trends. PERF-341 - Getting issue details... STATUS
The figures achieved in PTF performance testing have not been achieved in Nolana Bugfest. Developers are reviewing the results to determinethe causes for the differences, in MODDATAIMP-752 - Getting issue details... STATUS
Infrastructure
- 10 m6i.2xlarge EC2 instances
- 2 instances of db.r6.xlarge database instances, one reader and one writer
- MSK
- 4 m5.2xlarge brokers in 2 zones
- auto.create-topics.enable = true
- log.retention.minutes=480
- 2 partitions per DI topics
- default.replication.factor=3
- mod-inventory memory
- 1024 CPU units, 2592MB mem
- inventory.kafka.DataImportConsumerVerticle.instancesNumber=10
- inventory.kafka.MarcBibInstanceHridSetConsumerVerticle.instancesNumber=10
- kafka.consumer.max.poll.records=10
- mod-inventory-storage
- 1024 CPU units, 1962MB mem
- mod-source-record-storage
- 1024 CPU units, 1440MB mem
- mod-source-record-manager
- 1024 CPU units, 3688MB mem
- mod-data-import
- 256 CPU units, 1844MB mem
- mod-data-import-cs
- 128 CPU units, 896MB mem
Software versions
- mod-data-import v2.6.1
- mod-data-import-converter-storage v1.15.1
- mod-source-record-manager v3.5.0
- mod-source-record-storage v5.5.2
- mod-inventory v19.0.1
- mod-inventory-storage v25.0.1
Summary
- Data Import in Nolana has more or less the same DI durations as Morning Glory. For instance it's +20 seconds for 10K creation, however it's - 40 s for updates, for 50K records it's +2 minutes on creation and -2 minutes for updates.
- One issue was detected it's MODSOURMAN-908 . This is deadlocks in database which make DI work slow (when issue happens on 50 K duration increases up to 6 hours).
- After MODSOURMAN-908 was fixed - we were not able to reproduce this deadlock issue.
- R/W Split Enabled:
- For most of tests we can see an improvement of DI duration. For example 10K create with R/W split - 3m 43s, without R/W split it's 4m 55 s.
- We can see that RDS CPU usage on writer node is even higher than it was without read/write split enable.
- With R/W split for data import creates/updates - reader node took on 15-17% of DB load.
- MARC BIB Update and Create take less time for Nolana with new version of DI modules*. PERF-388 - Getting issue details... STATUS reproduced for 10k MARC BIB Update without Check-In/Check-Out. For job started after 5k MARC BIB Update with less than a minute timeout between jobs.
Results
Duration Nolana with new version of modules* | Duration Nolana | Duration Morning Glory | Duration Lotus | ||
|---|---|---|---|---|---|
| 1K MARC Create | PTF - Create 2 | 40 s | 46 s | 50 s | 1 min 9 s |
1K MARC Update | PTF - Updates Success - 1 | 35 s | 50 s | 39s | 1 min 30 s |
| 2K MARC Create | PTF - Create 2 | 56 s | 1 min 13 s | 1 min 2s | 1 min 34 s |
| 2K MARC Update | PTF - Updates Success - 1 | 58 s | 1 min 7 s | 1 min 11 s | 1 min 54 s |
5K MARC Create | PTF - Create 2 | 2m 8 s | 2 min 51 s | 2 min 20s | 3 min 54 s |
| 5K MARC Update | PTF - Updates Success - 1 | 2 min 10 s | 2 min 27s | 3 min 4 s | 4 min 12 s |
10K MARC Create | PTF - Create 2 | 4 min 20 s | 4 min 55 s | 4 min 33 s | 6 min 45 s |
| 10K MARC Update | PTF - Updates Success - 1 | 4 min 8 s | 4 min 50 s | 5 min 29 s | 8 min 4 s |
| 25K MARC Create | PTF - Create 2 | 10 min 41 s | 11 min 56 s | 10 min 55 s | 16 min 8s |
| 25K MARC Update | PTF - Updates Success - 1 | 10 min 40 s | 12 min 20 s | 13 min 37 s | 19 min 50s |
| 50K MARC Create | PTF - Create 2 | 21 min 11 s | 23 min 43 s | 21 min 37 s | 32 min 28 s |
50K MARC Update | PTF - Updates Success - 1 | 20 min 57 s | 24 min 5 s | 26 min 10 s | 39 min 5 s |
| 100K MARC Create | PTF - Create 2 | 42 min 35 s | 49 min 40 s | 44 min 4 s | 1 hr 11 min |
100K MARC Update | PTF - Updates Success - 1 | 41 min 56 s | 51 min 15 s | 55 min 33 s | 1 hr 19 min |
| 500K MARC Create | PTF - Create 2 | DNR | 4 hr 2 min Completed with errors* | 3 hr 55 min Completed with errors* | 7 hr 4 min (Completed with errors)* |
- 500K MARC Create import failed due to 500K records file corruption.
- So far we can only compare results of PTF-Create-2 job profile, while Update-success-2 is not available on our Morning-Glory env.
* - Modules and versions comparison table
| Nolana | new version | old version |
|---|---|---|
| mod-data-import | 2.6.2 | 2.6.1 |
| mod-data-import-converter-storage | 1.15.2 | 1.15.1 |
| mod-source-record-manager | 3.5.6 | 3.5.0 |
| mod-source-record-storage | 5.5.2 | 5.5.2 |
| mod-inventory | 19.0.2 | 19.0.1 |
| mod-inventory-storage | 25.0.3 | 25.0.1 |
Resources usage MARC Create
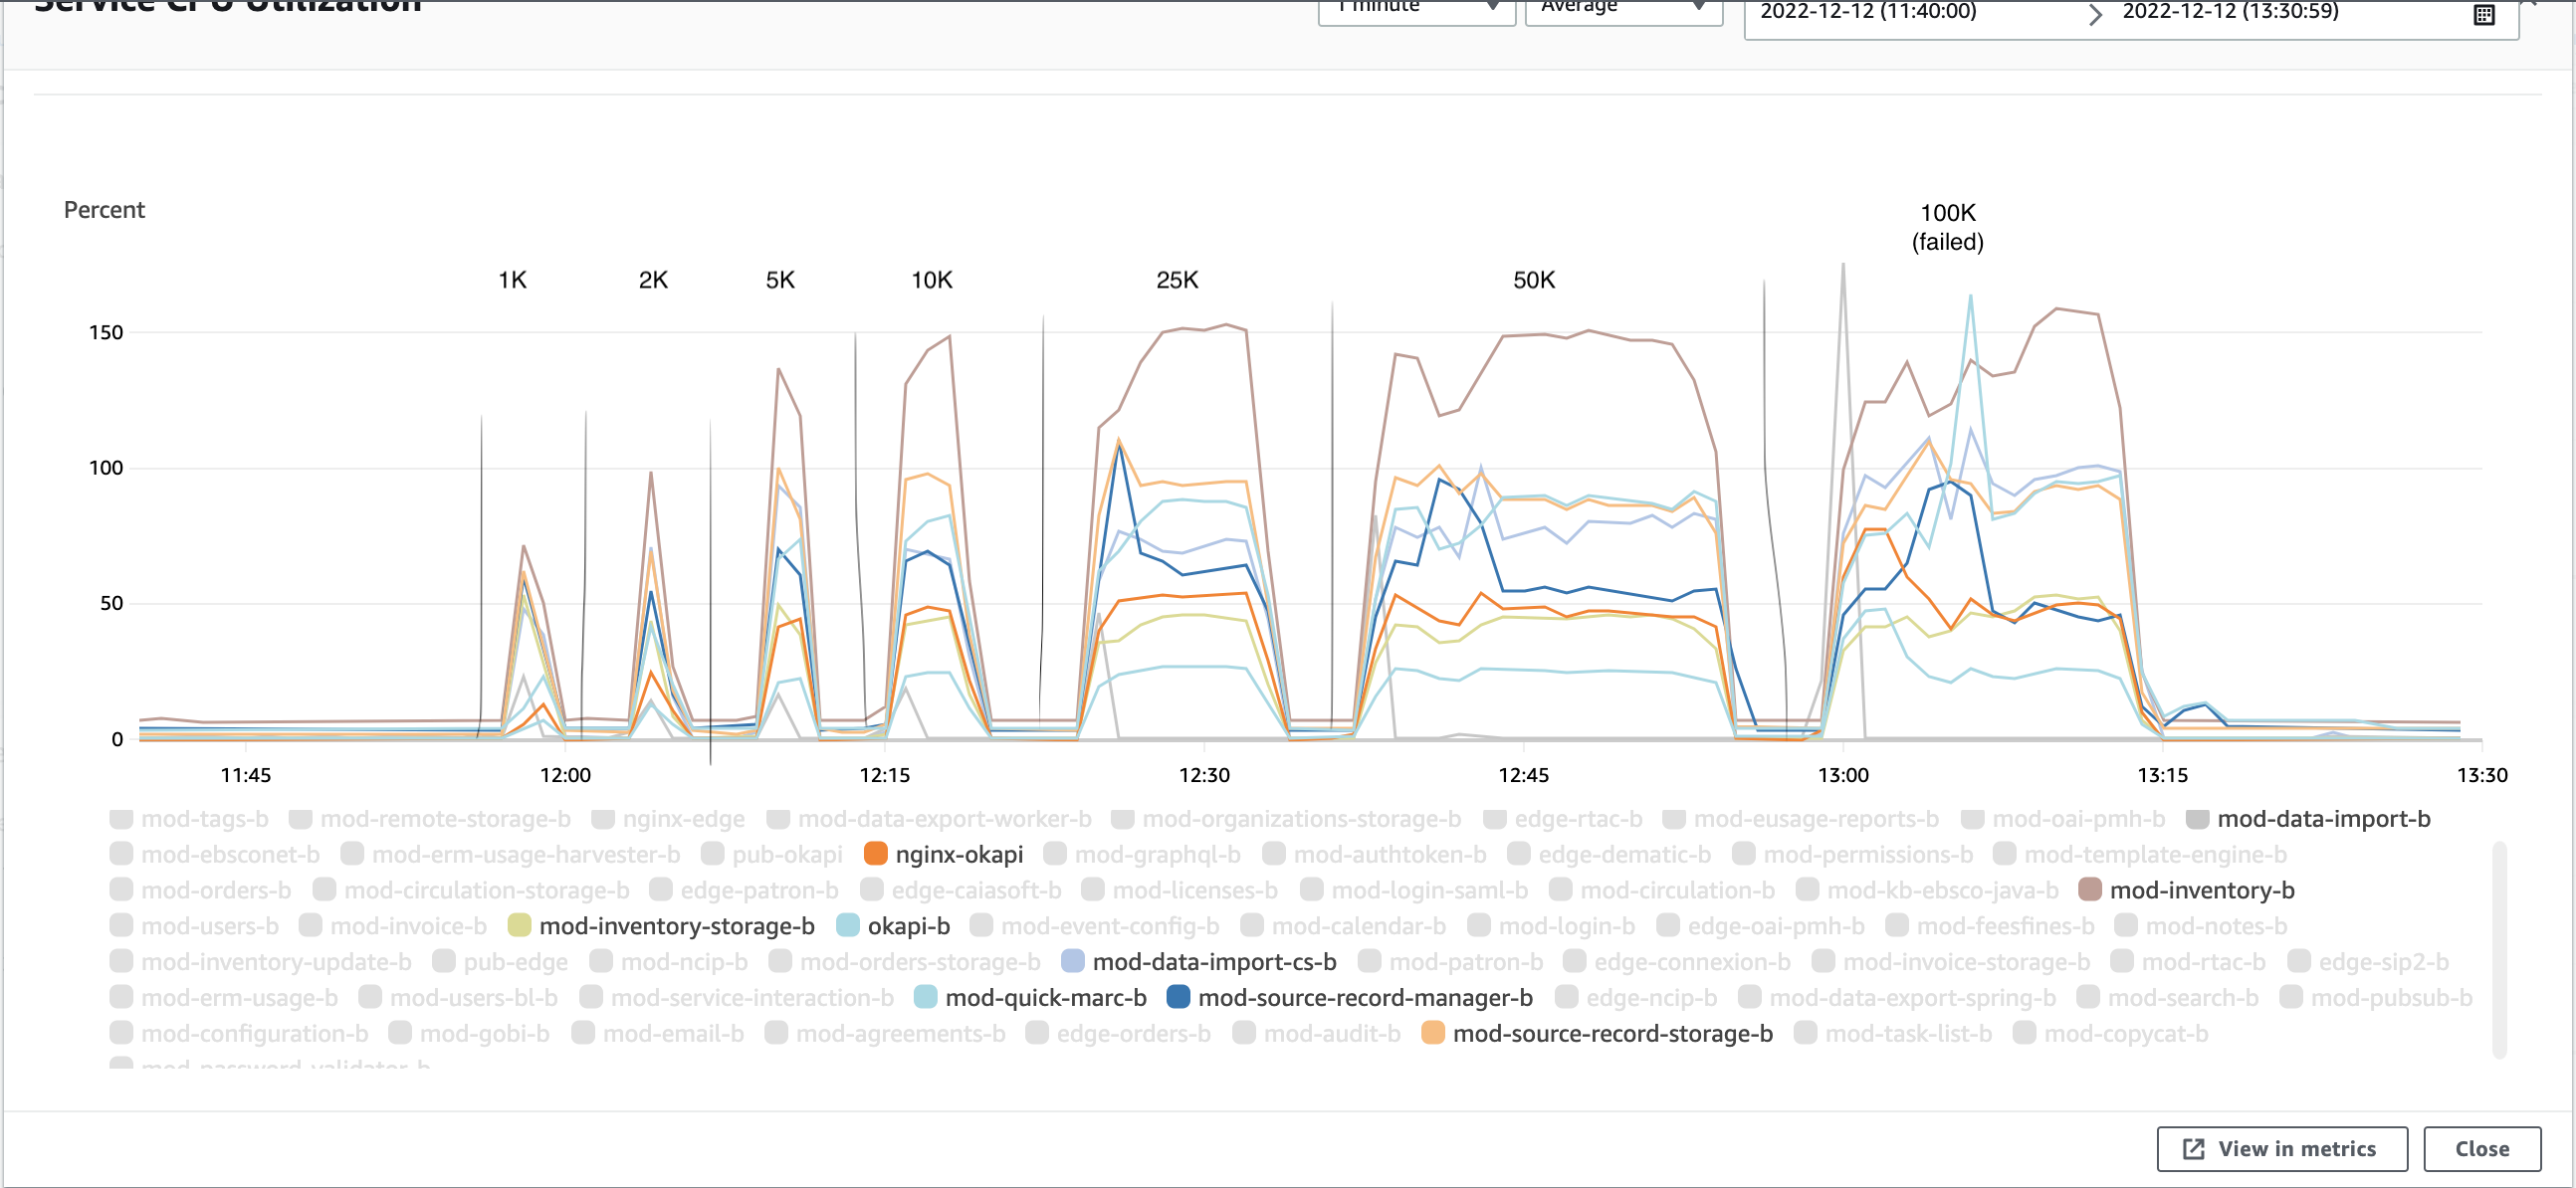
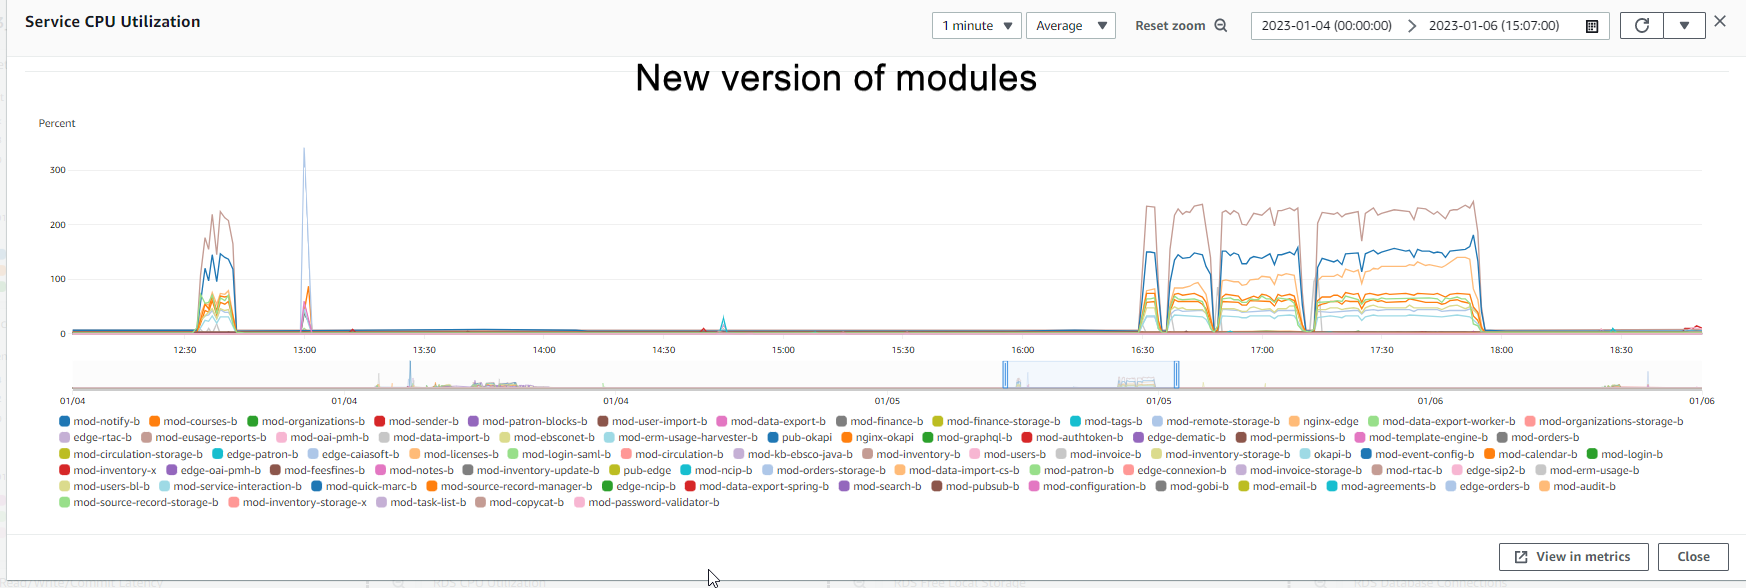
Note: CPU usage for mod-date-import-cs in Nolana release is less that it was for Morning Glory.
For MG release it was ±320%, and for Nolana it's less then 100%
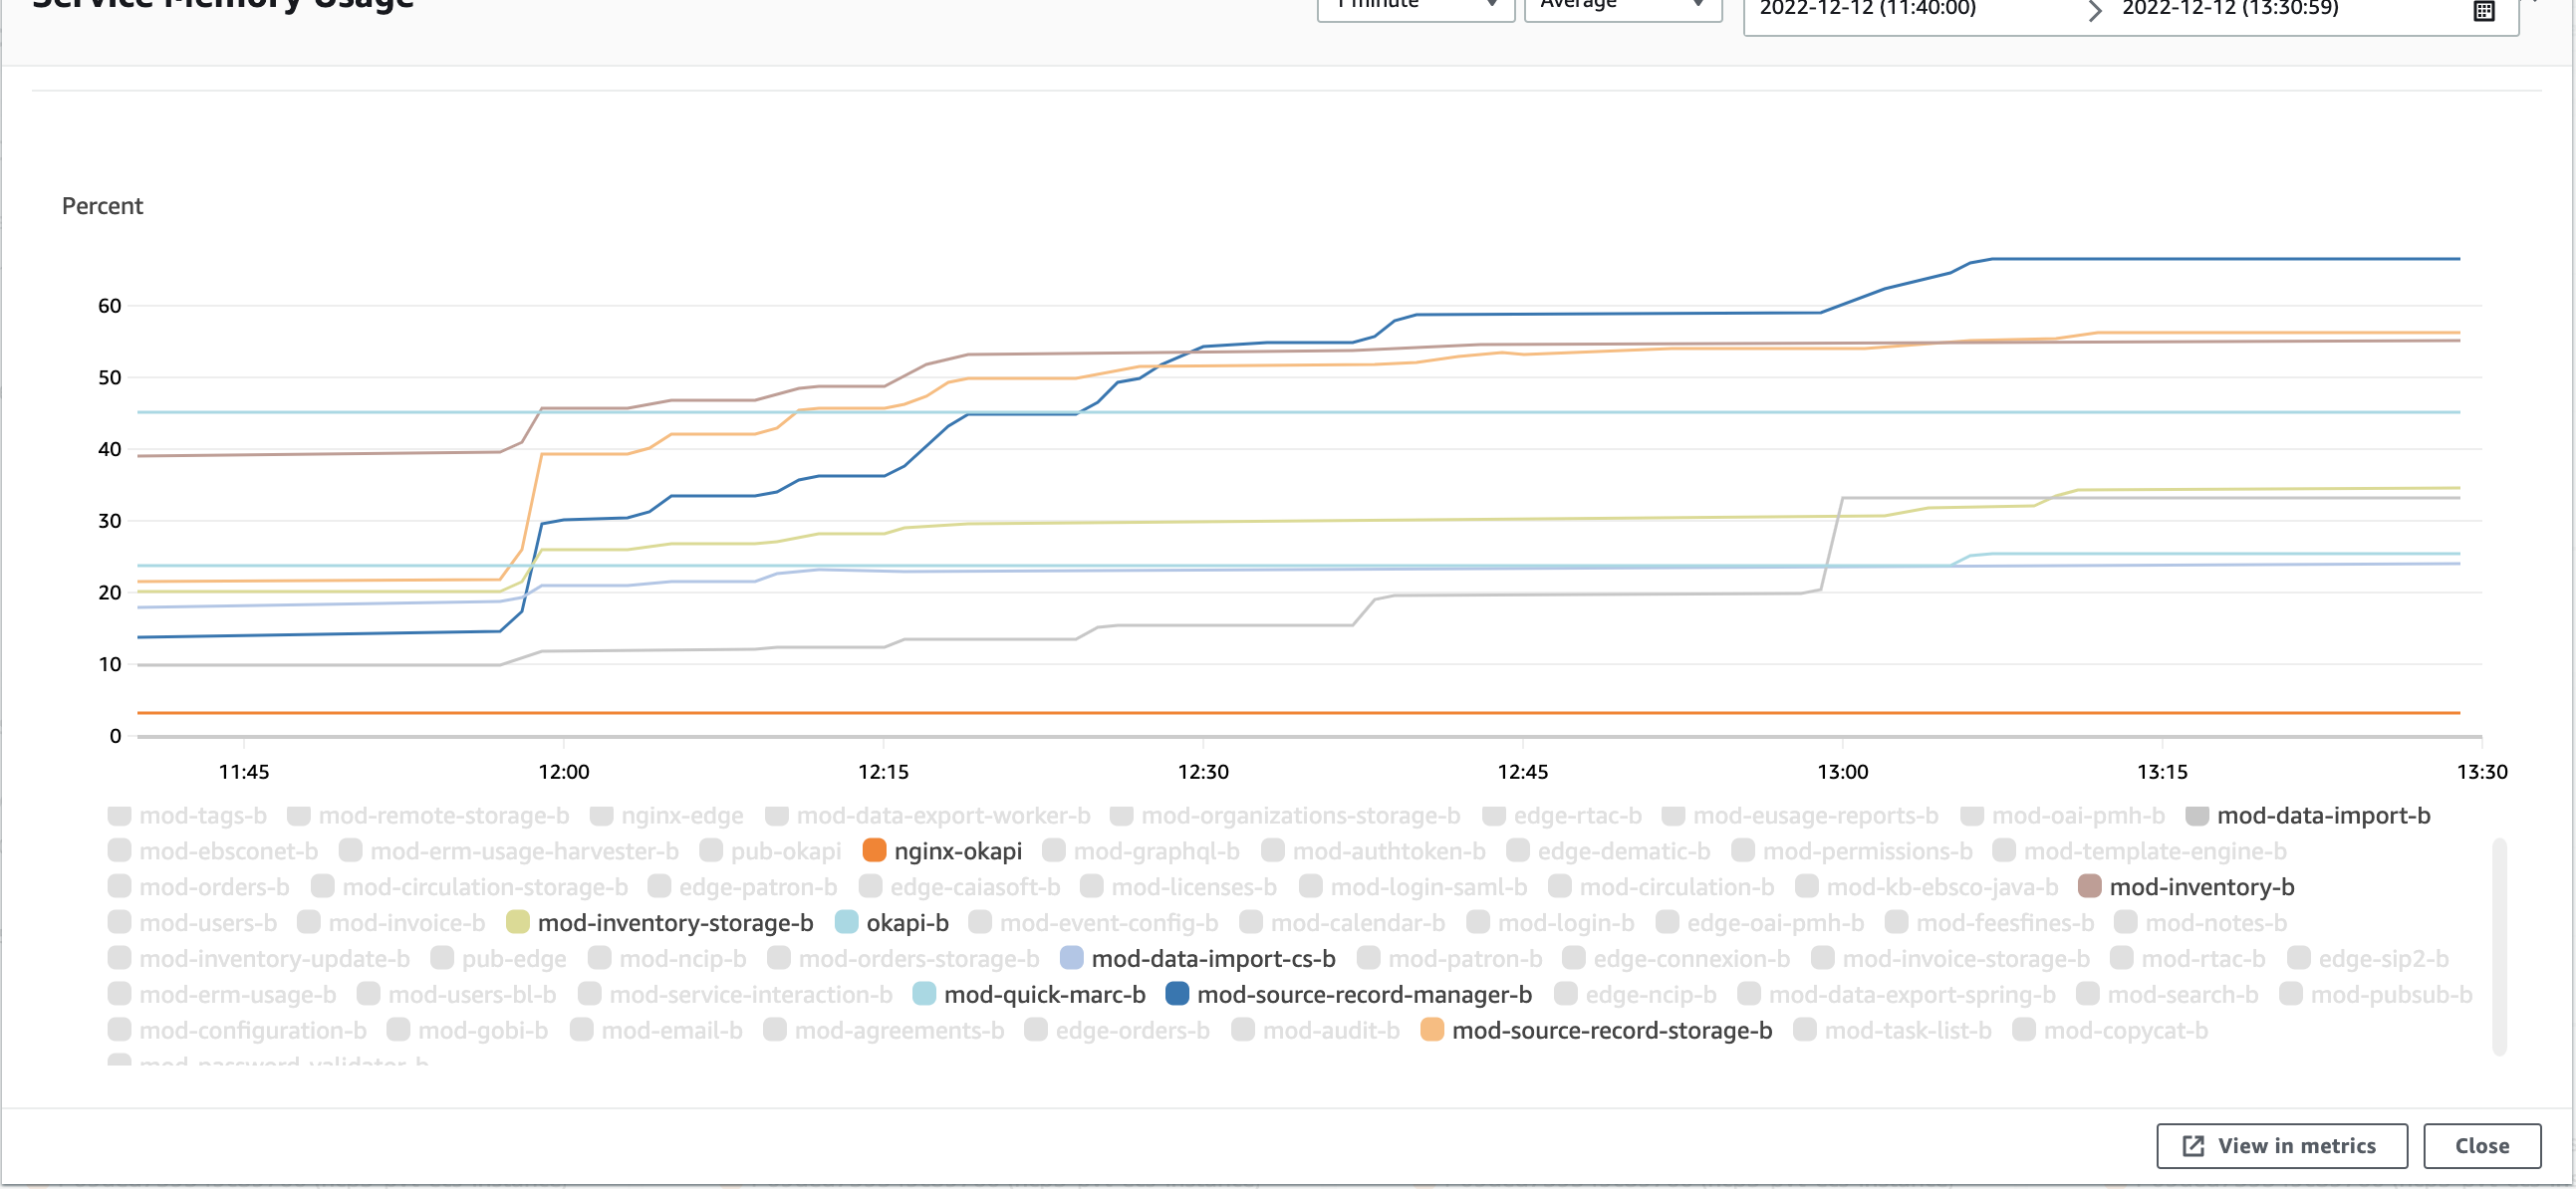
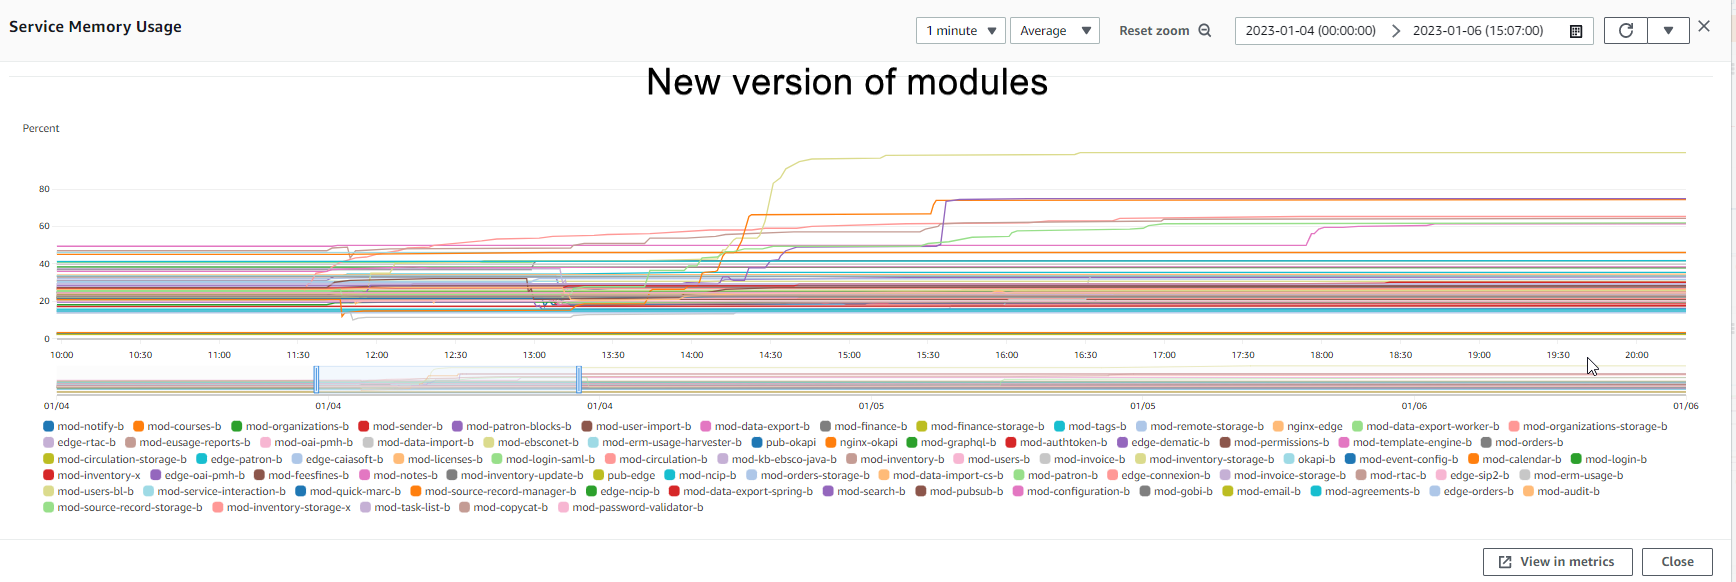
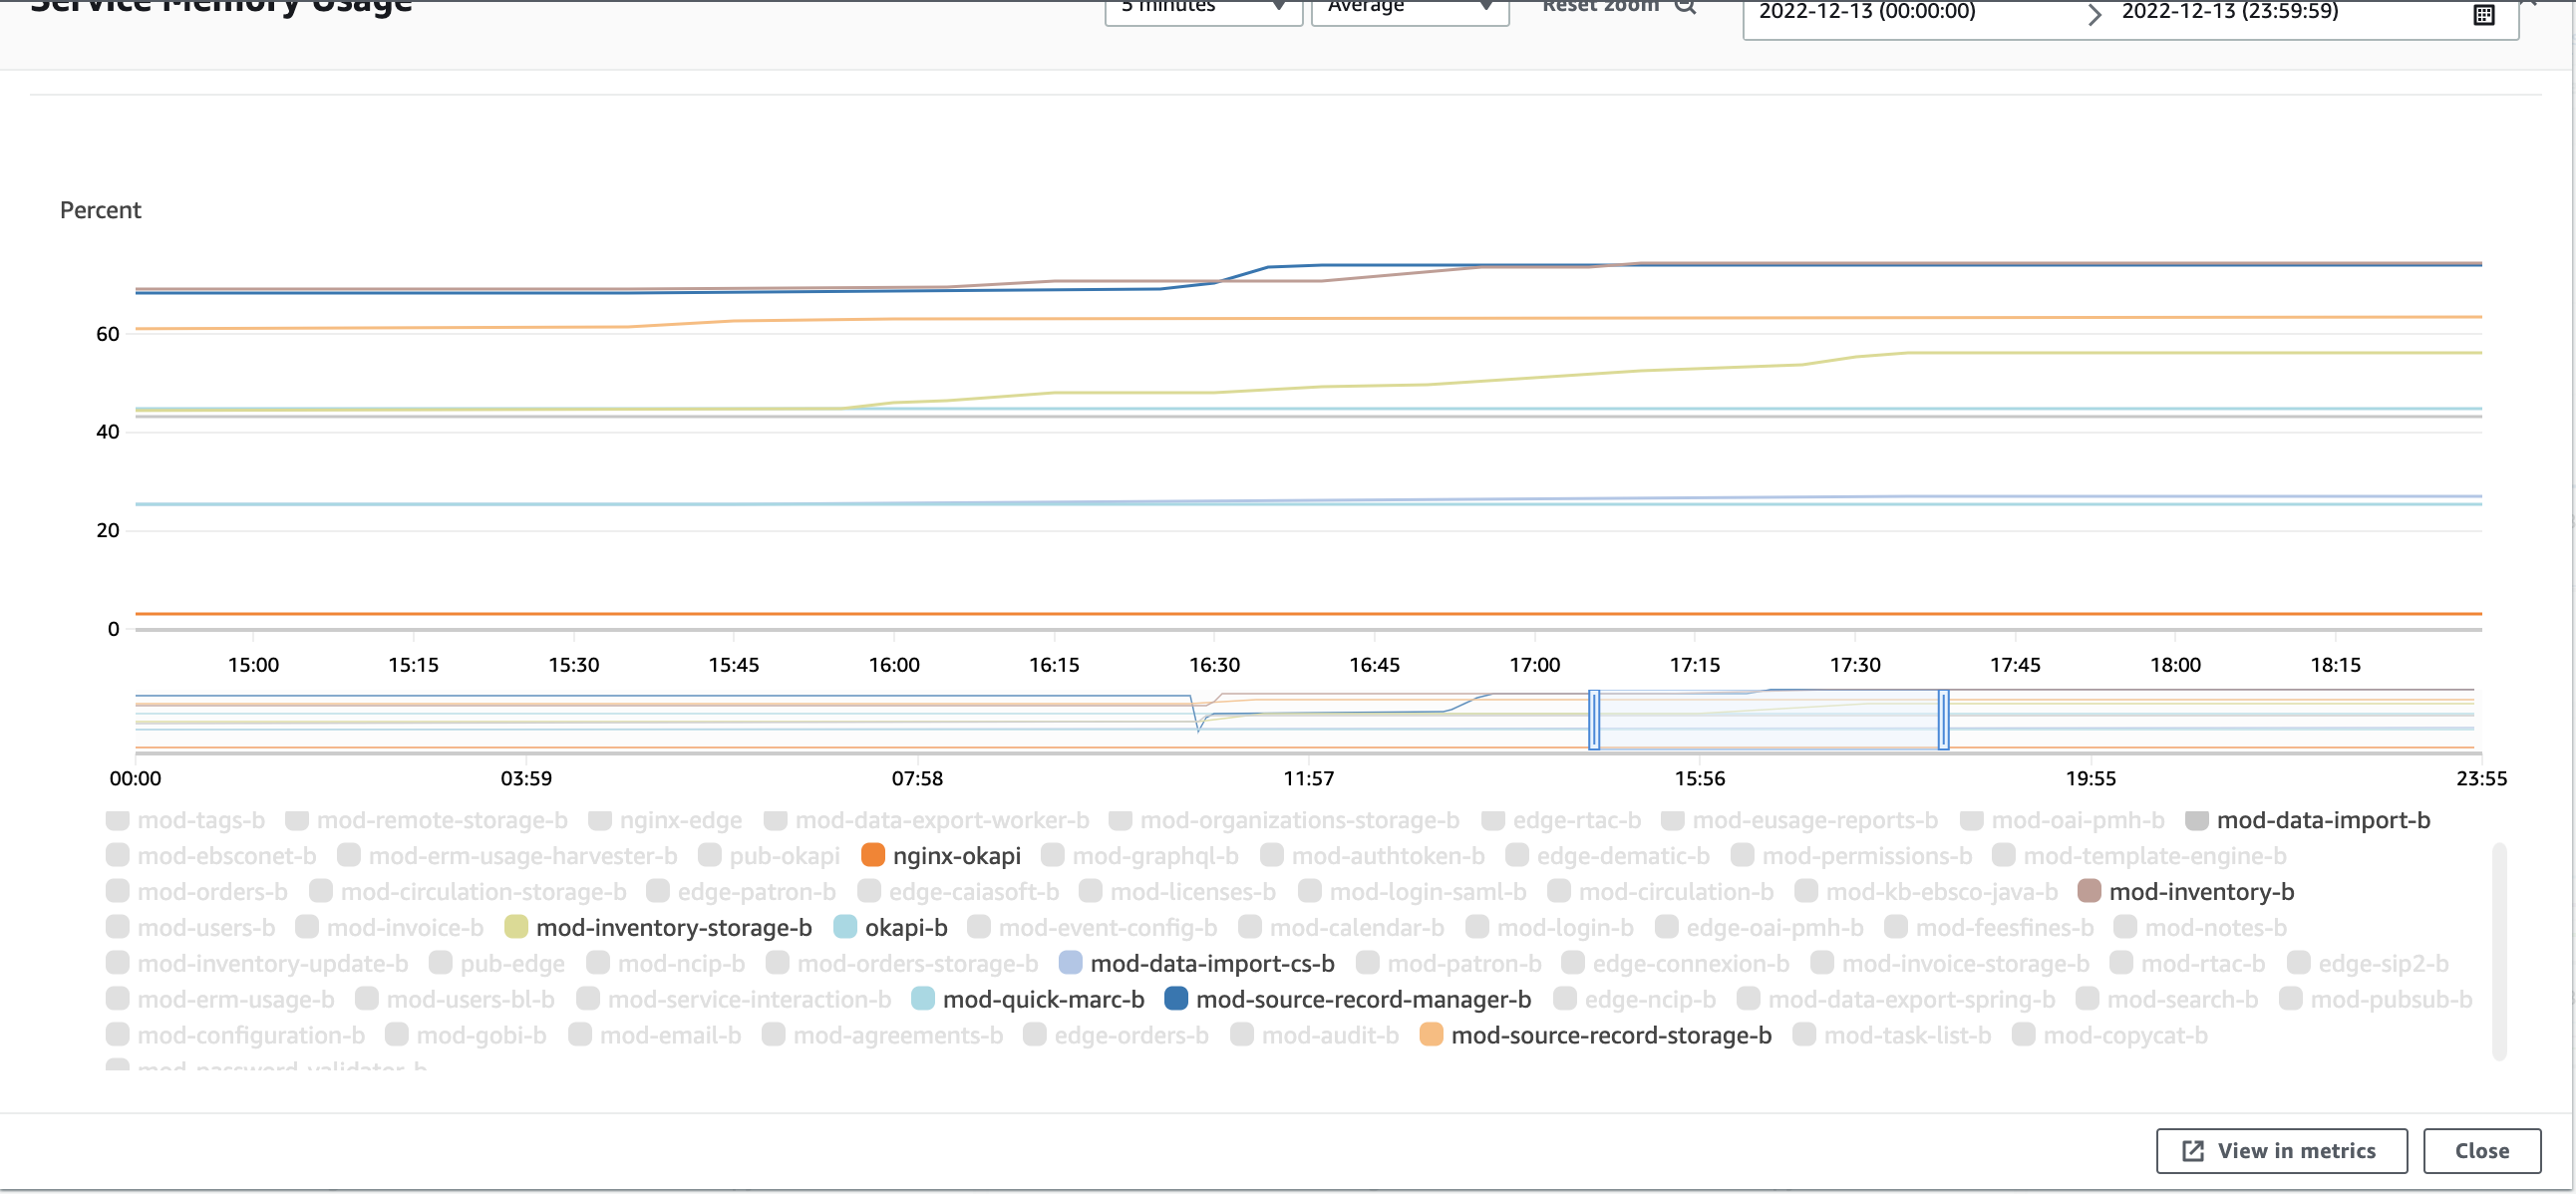
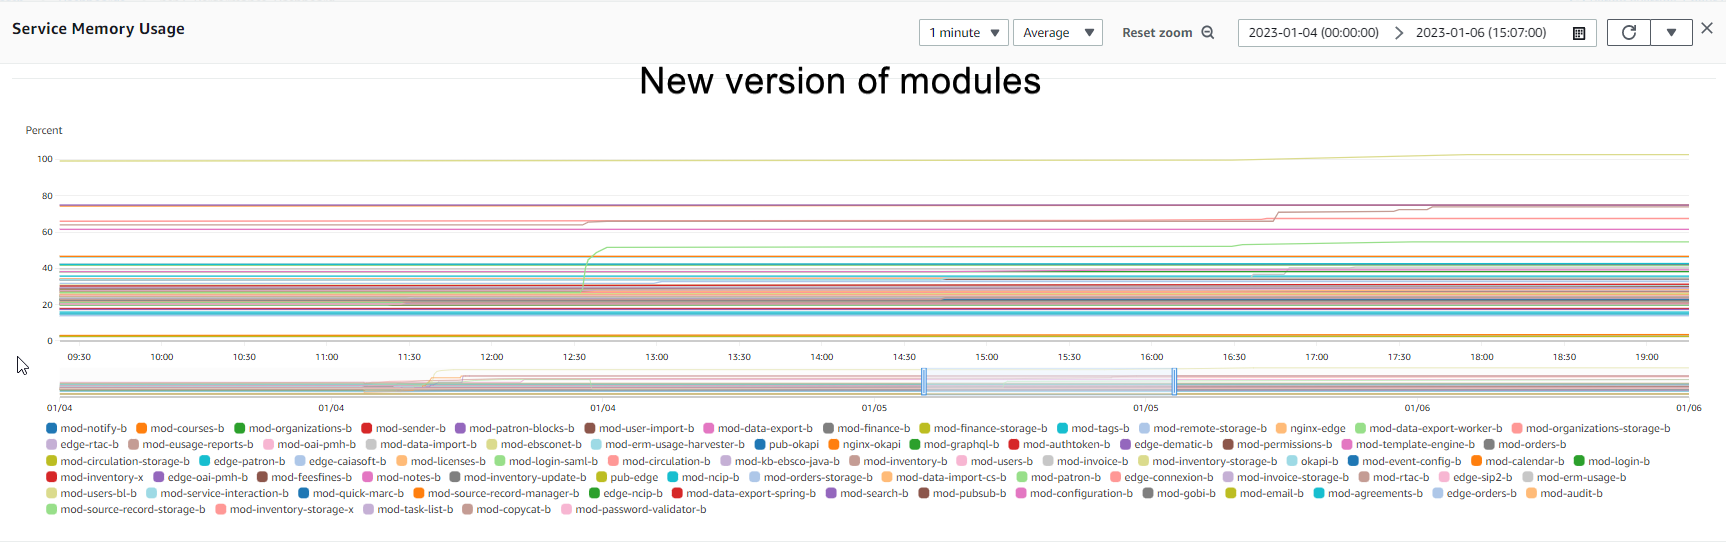
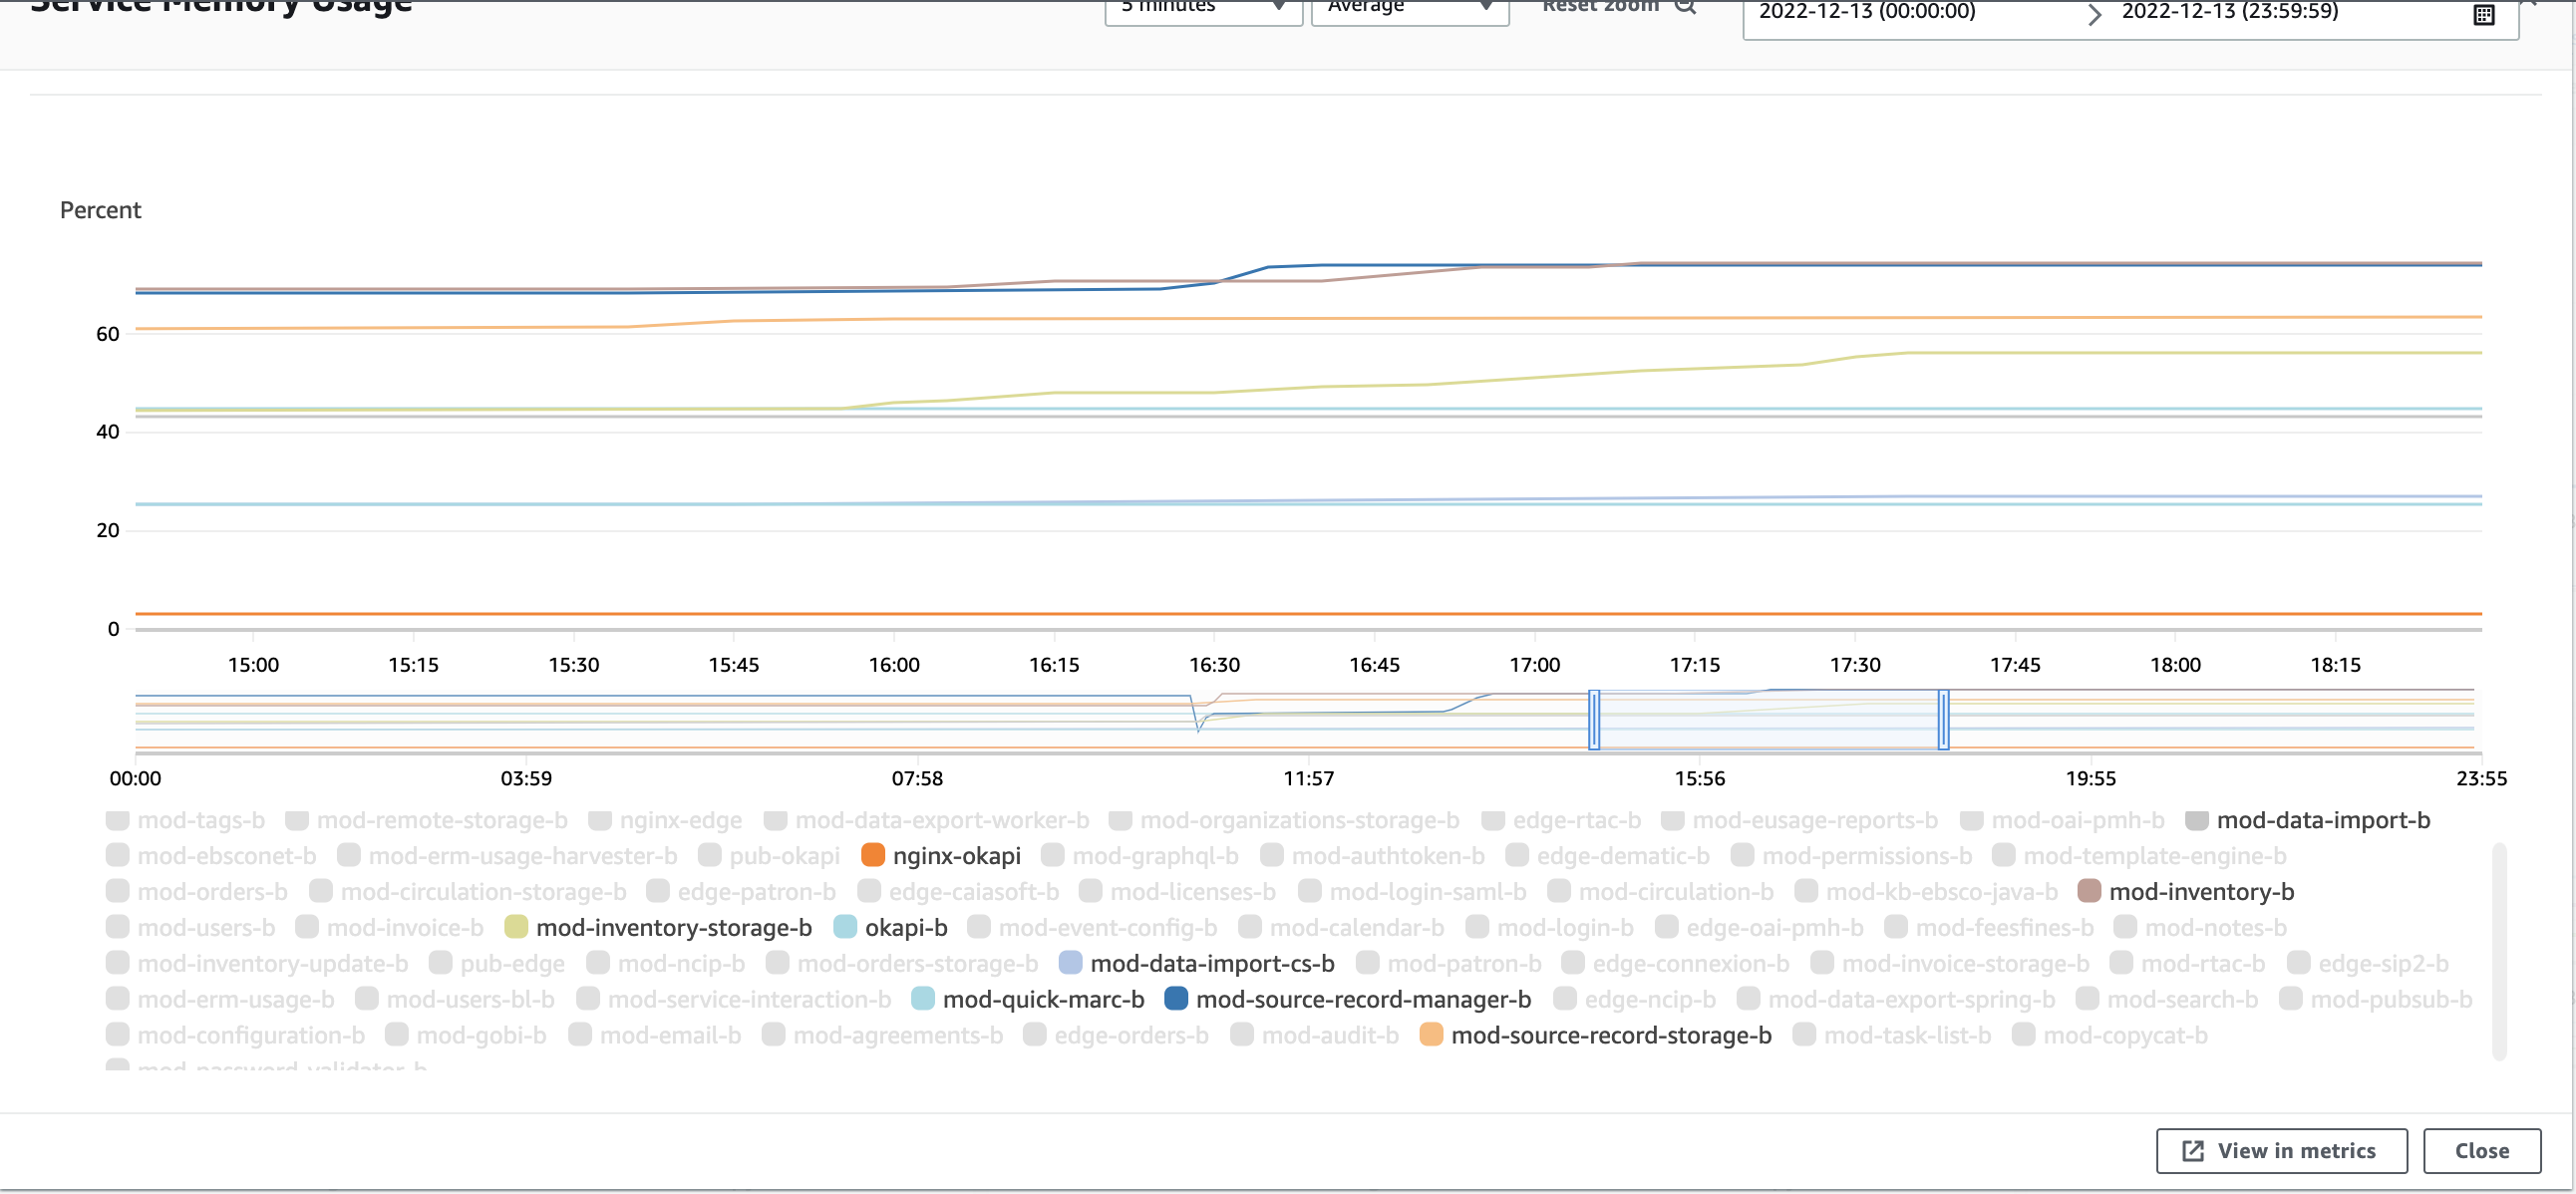
Note: We can observe increasing of memory usage for most related modules and it wasn't released even days later. Most disturbing part here is mod-data-import. It increases memory level from ±20% to 80%.
We'll investigate potential memory leak in future. PERF-358
Update: After additional investigation in scope of PERF-358 we can say that there is no memory leaks in any of the modules. For most of them memory will grow up to some point and then stop growing. See details in ticket.
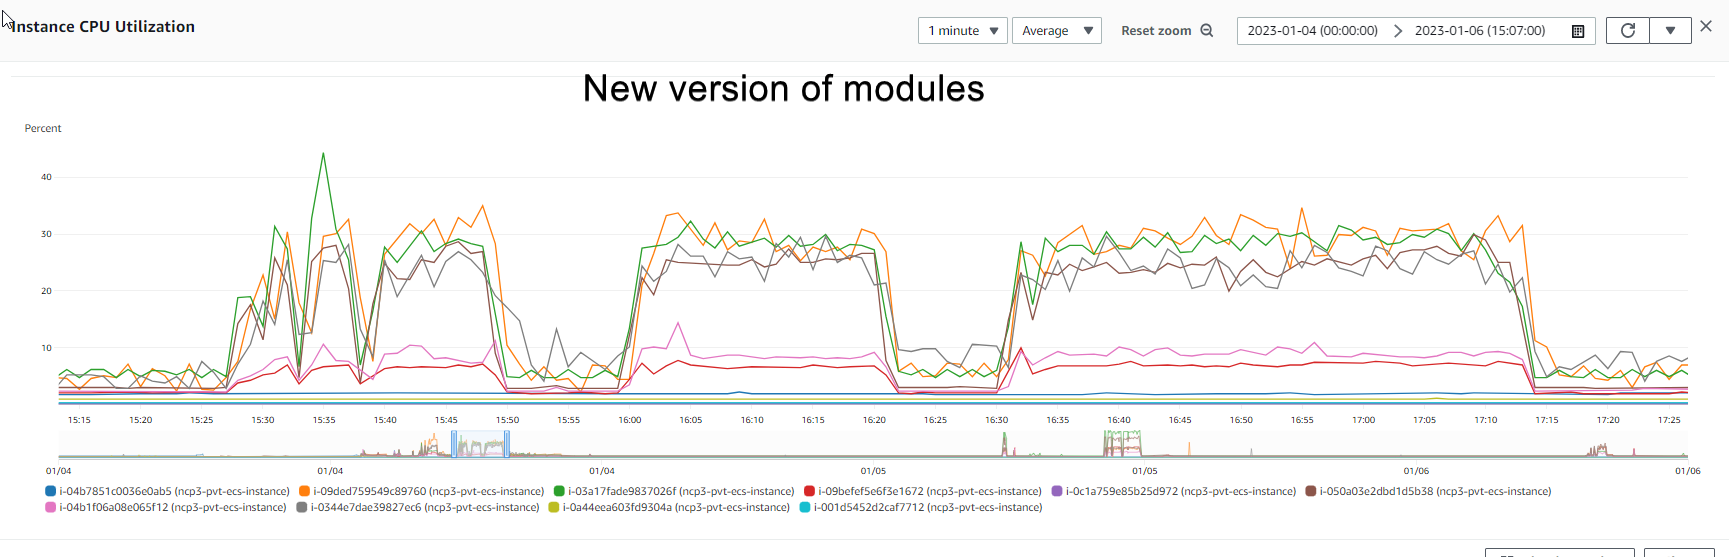
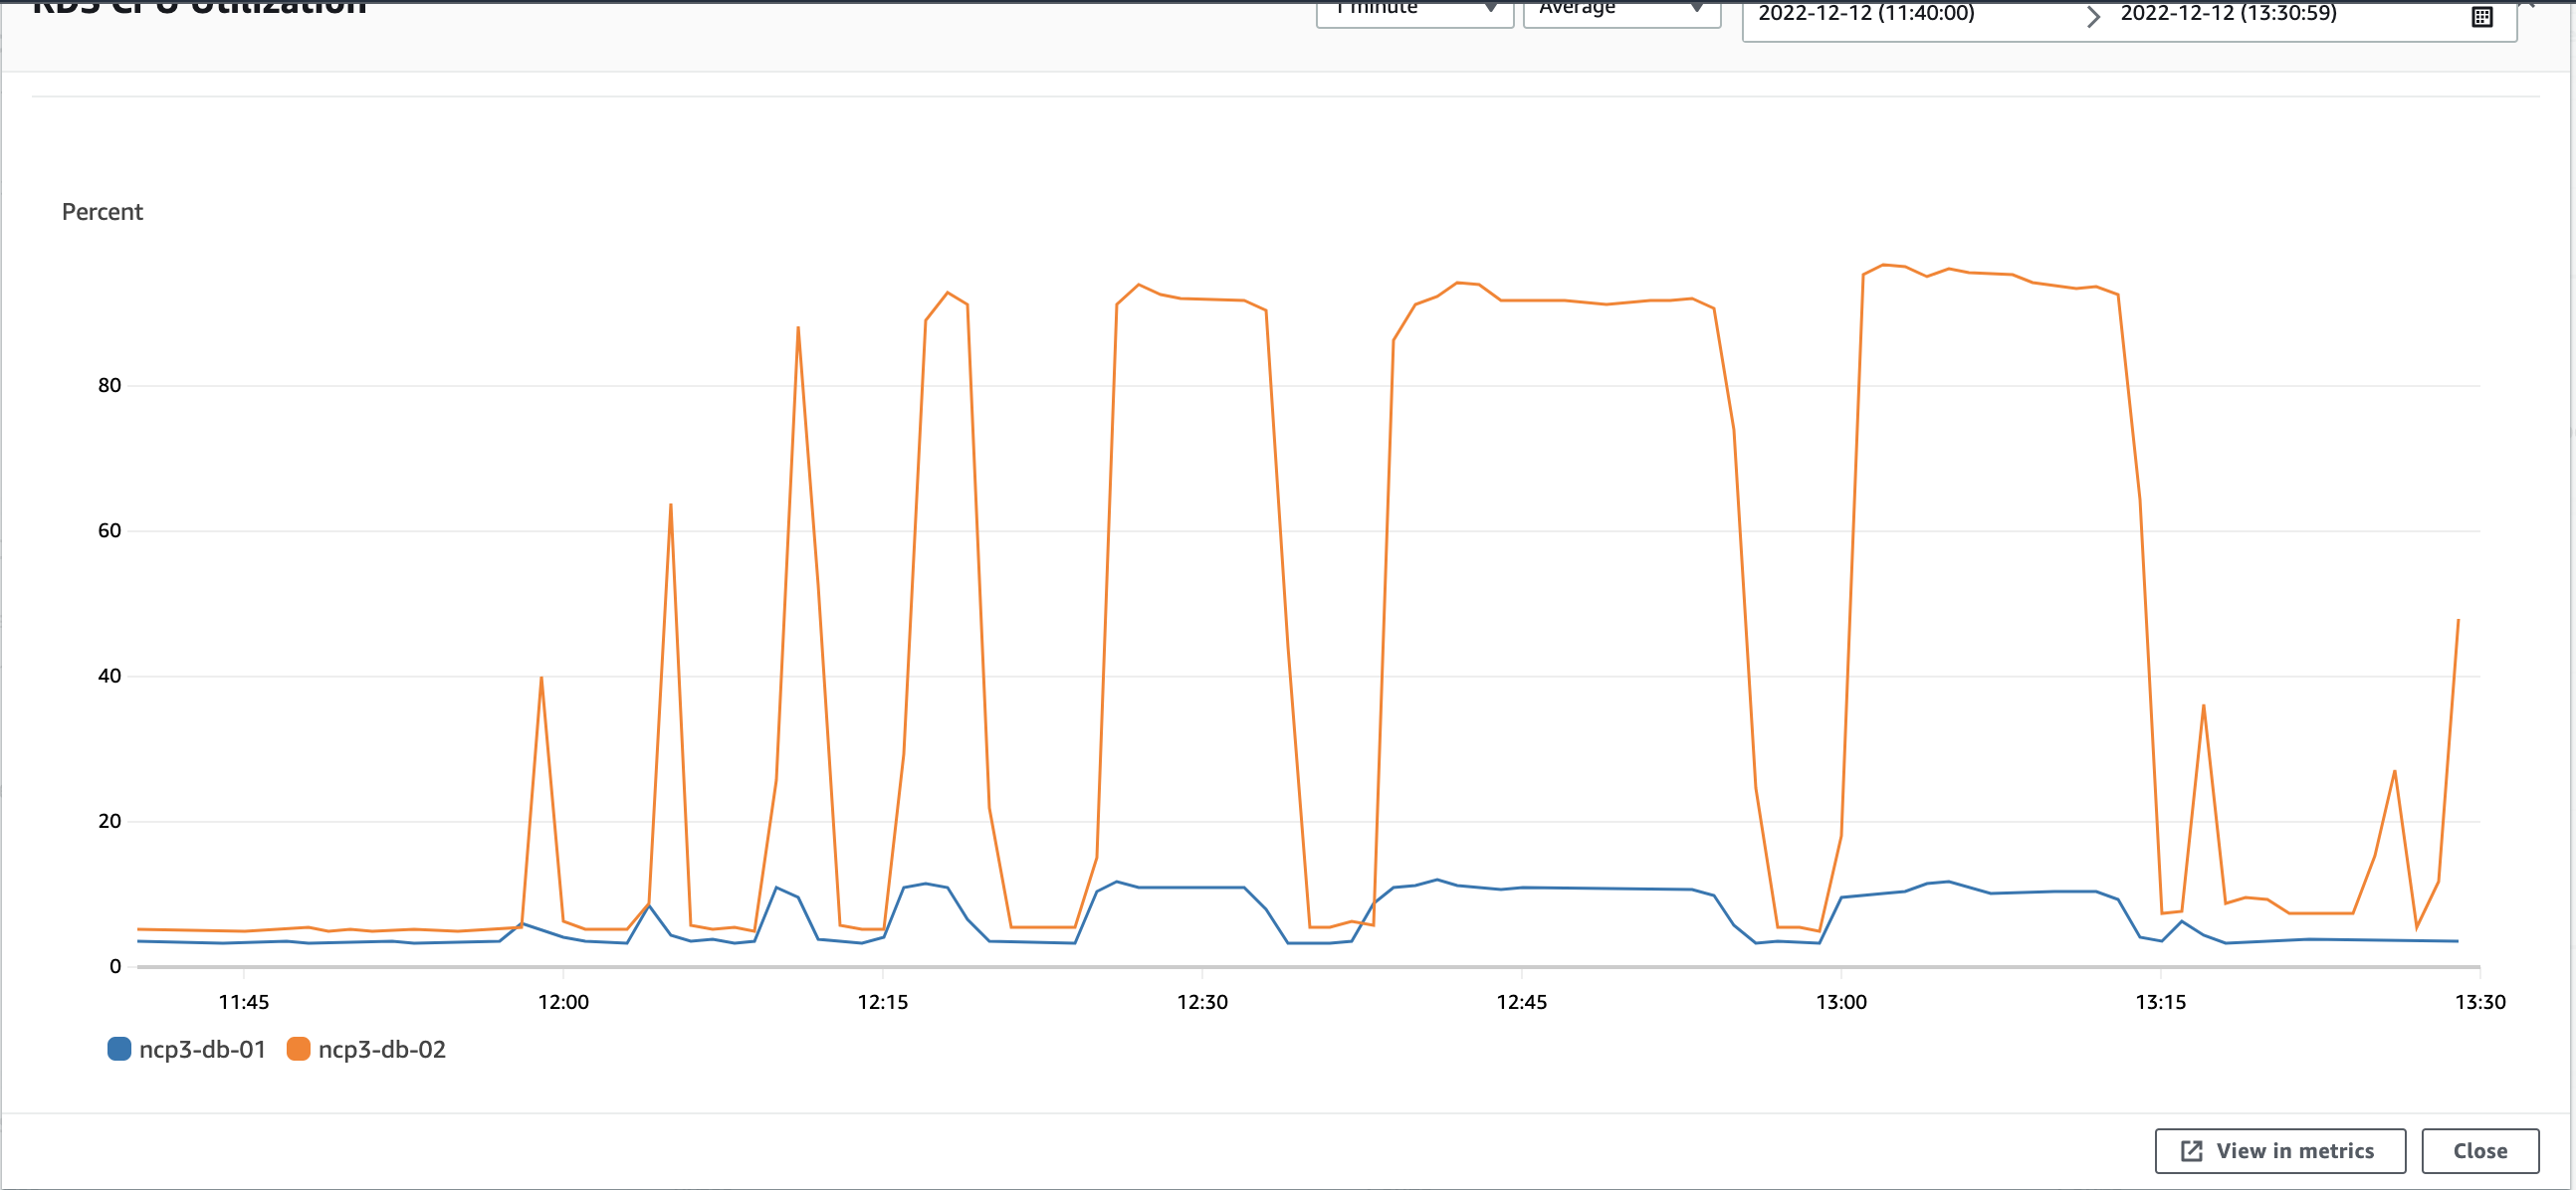
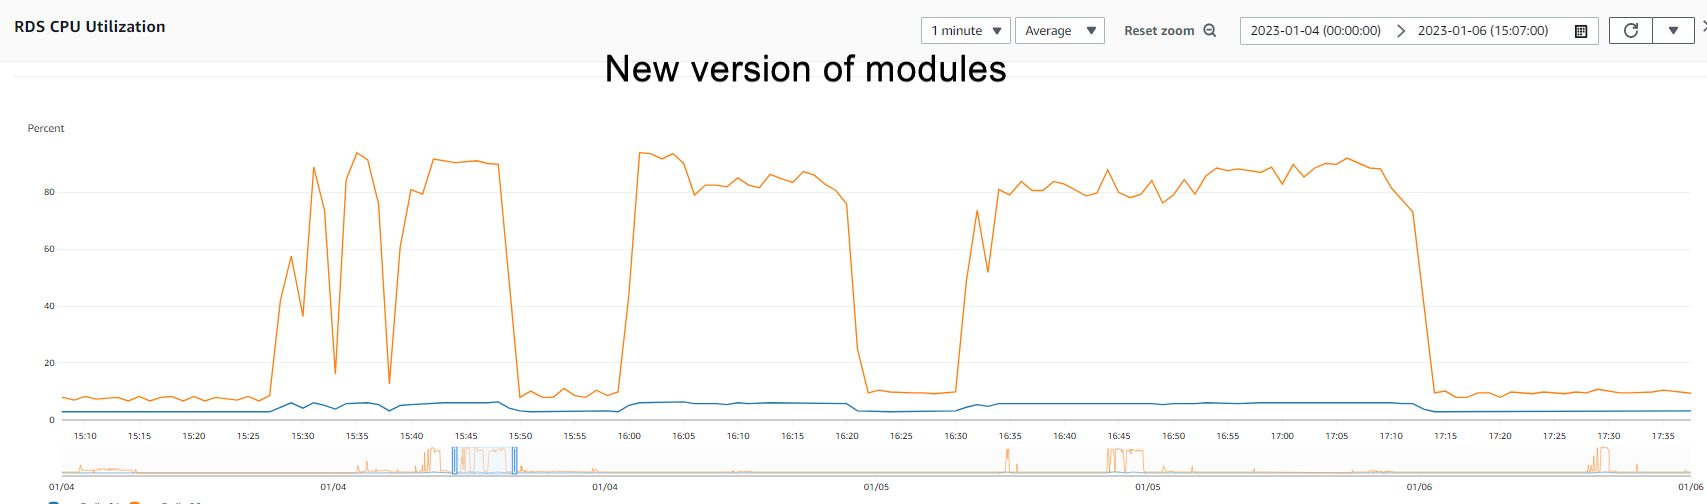
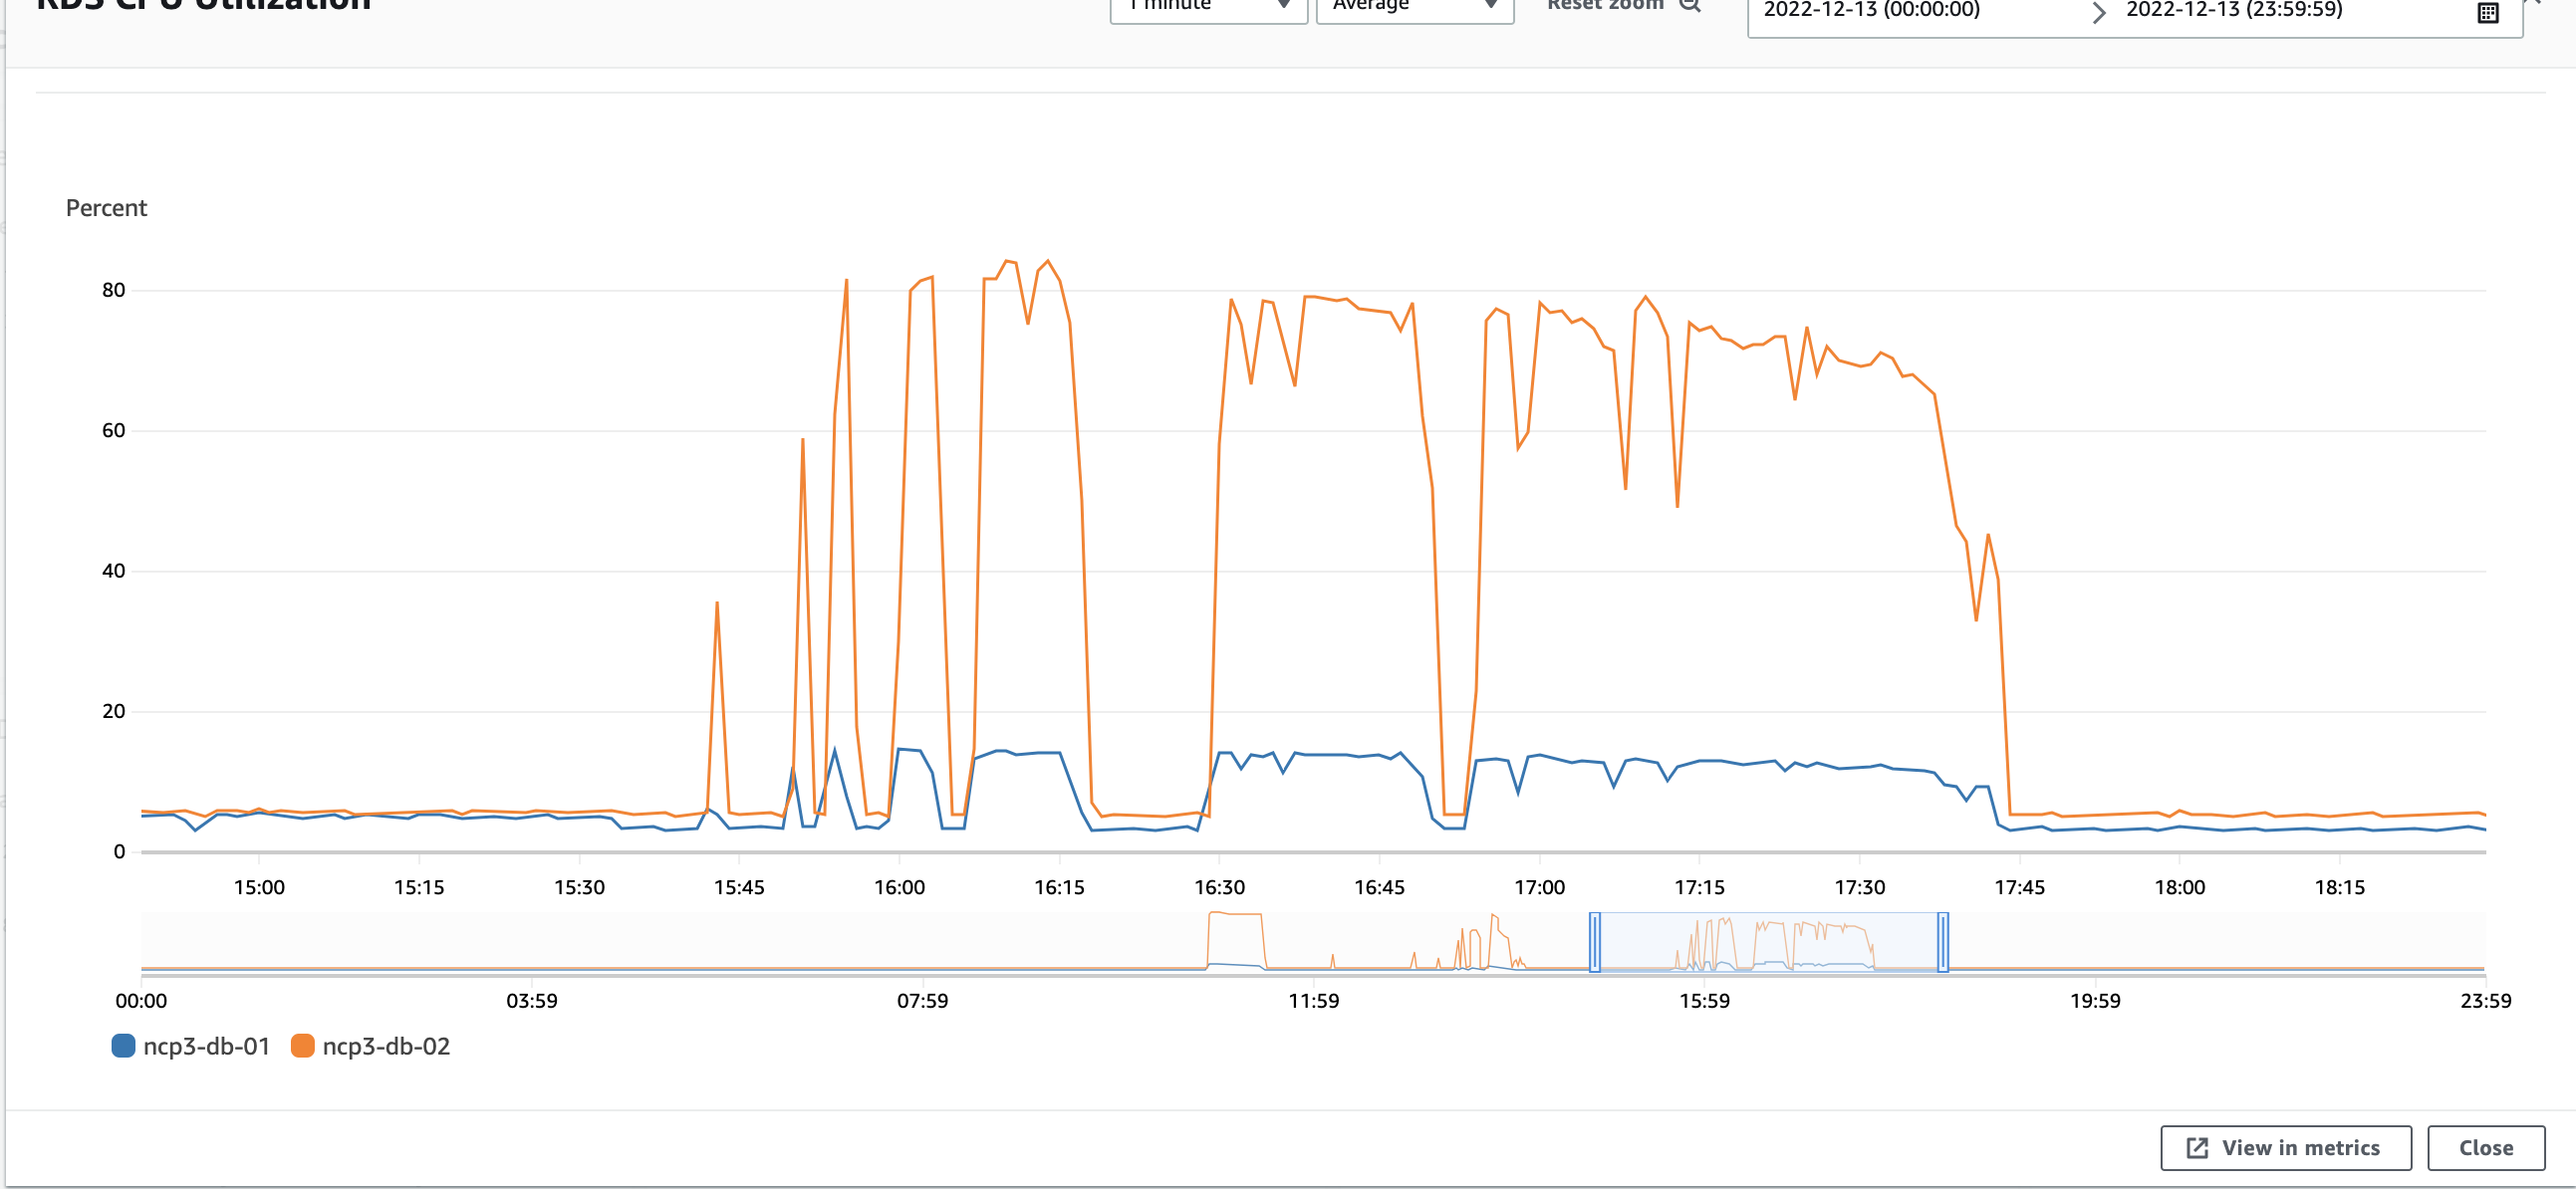
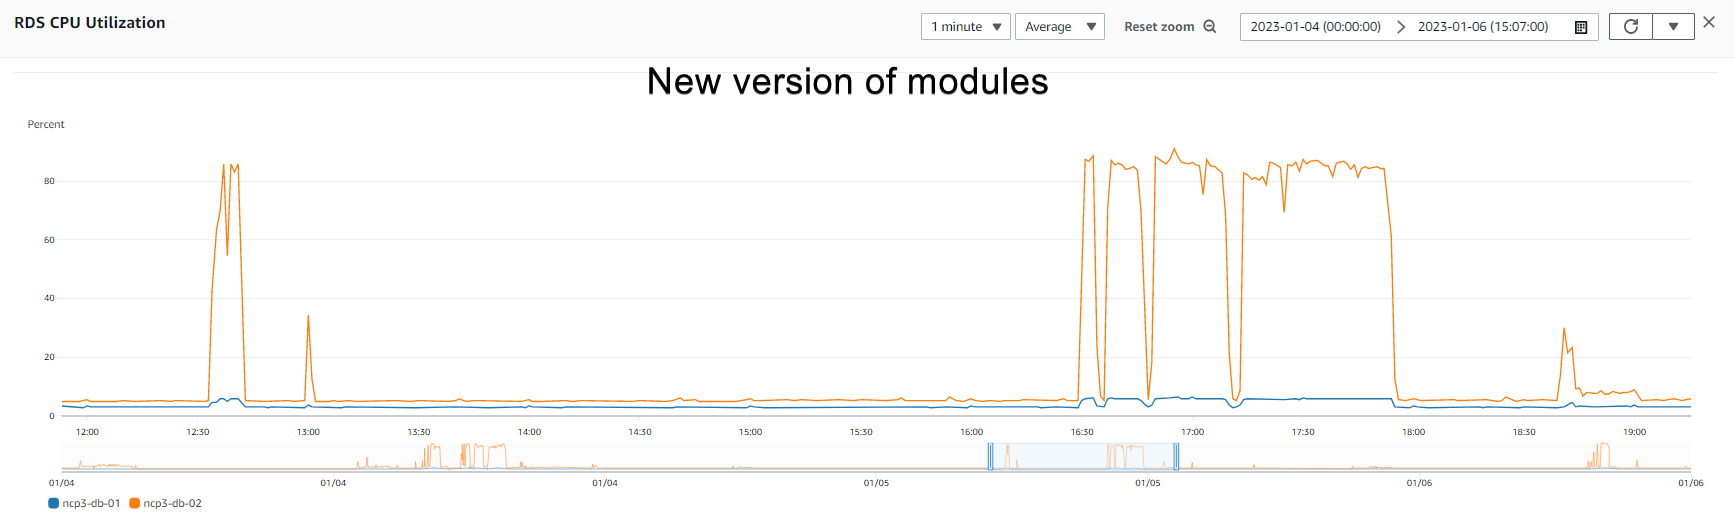
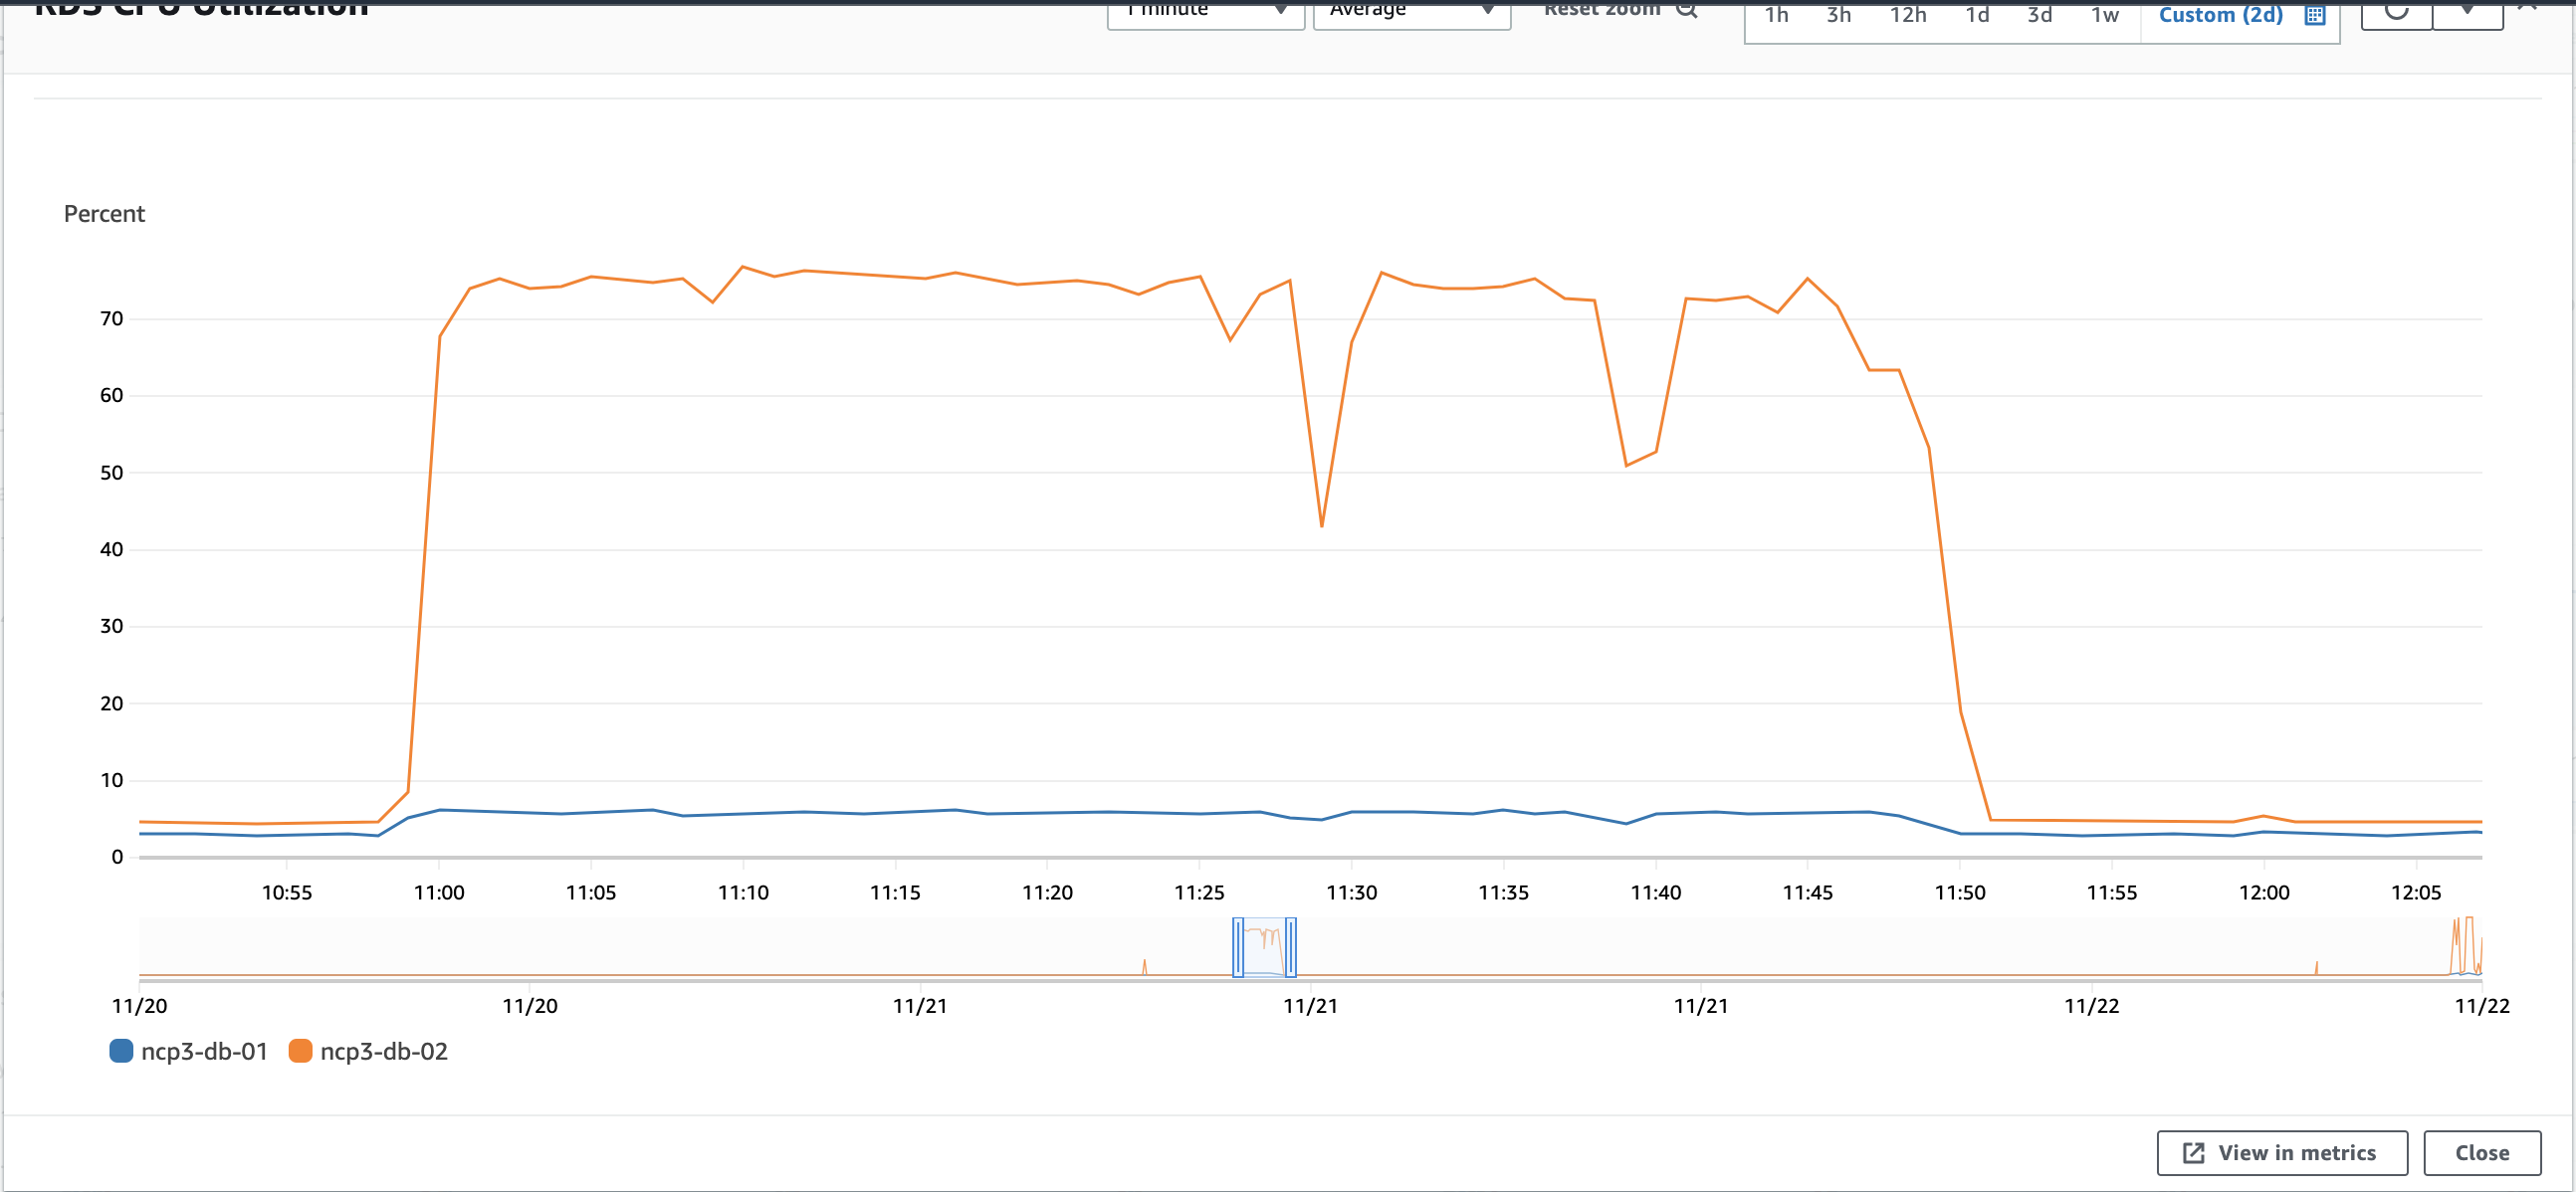
Note: RDS CPU usage stays the same as was in previous releases ±80%.
Resources usage MARC Update
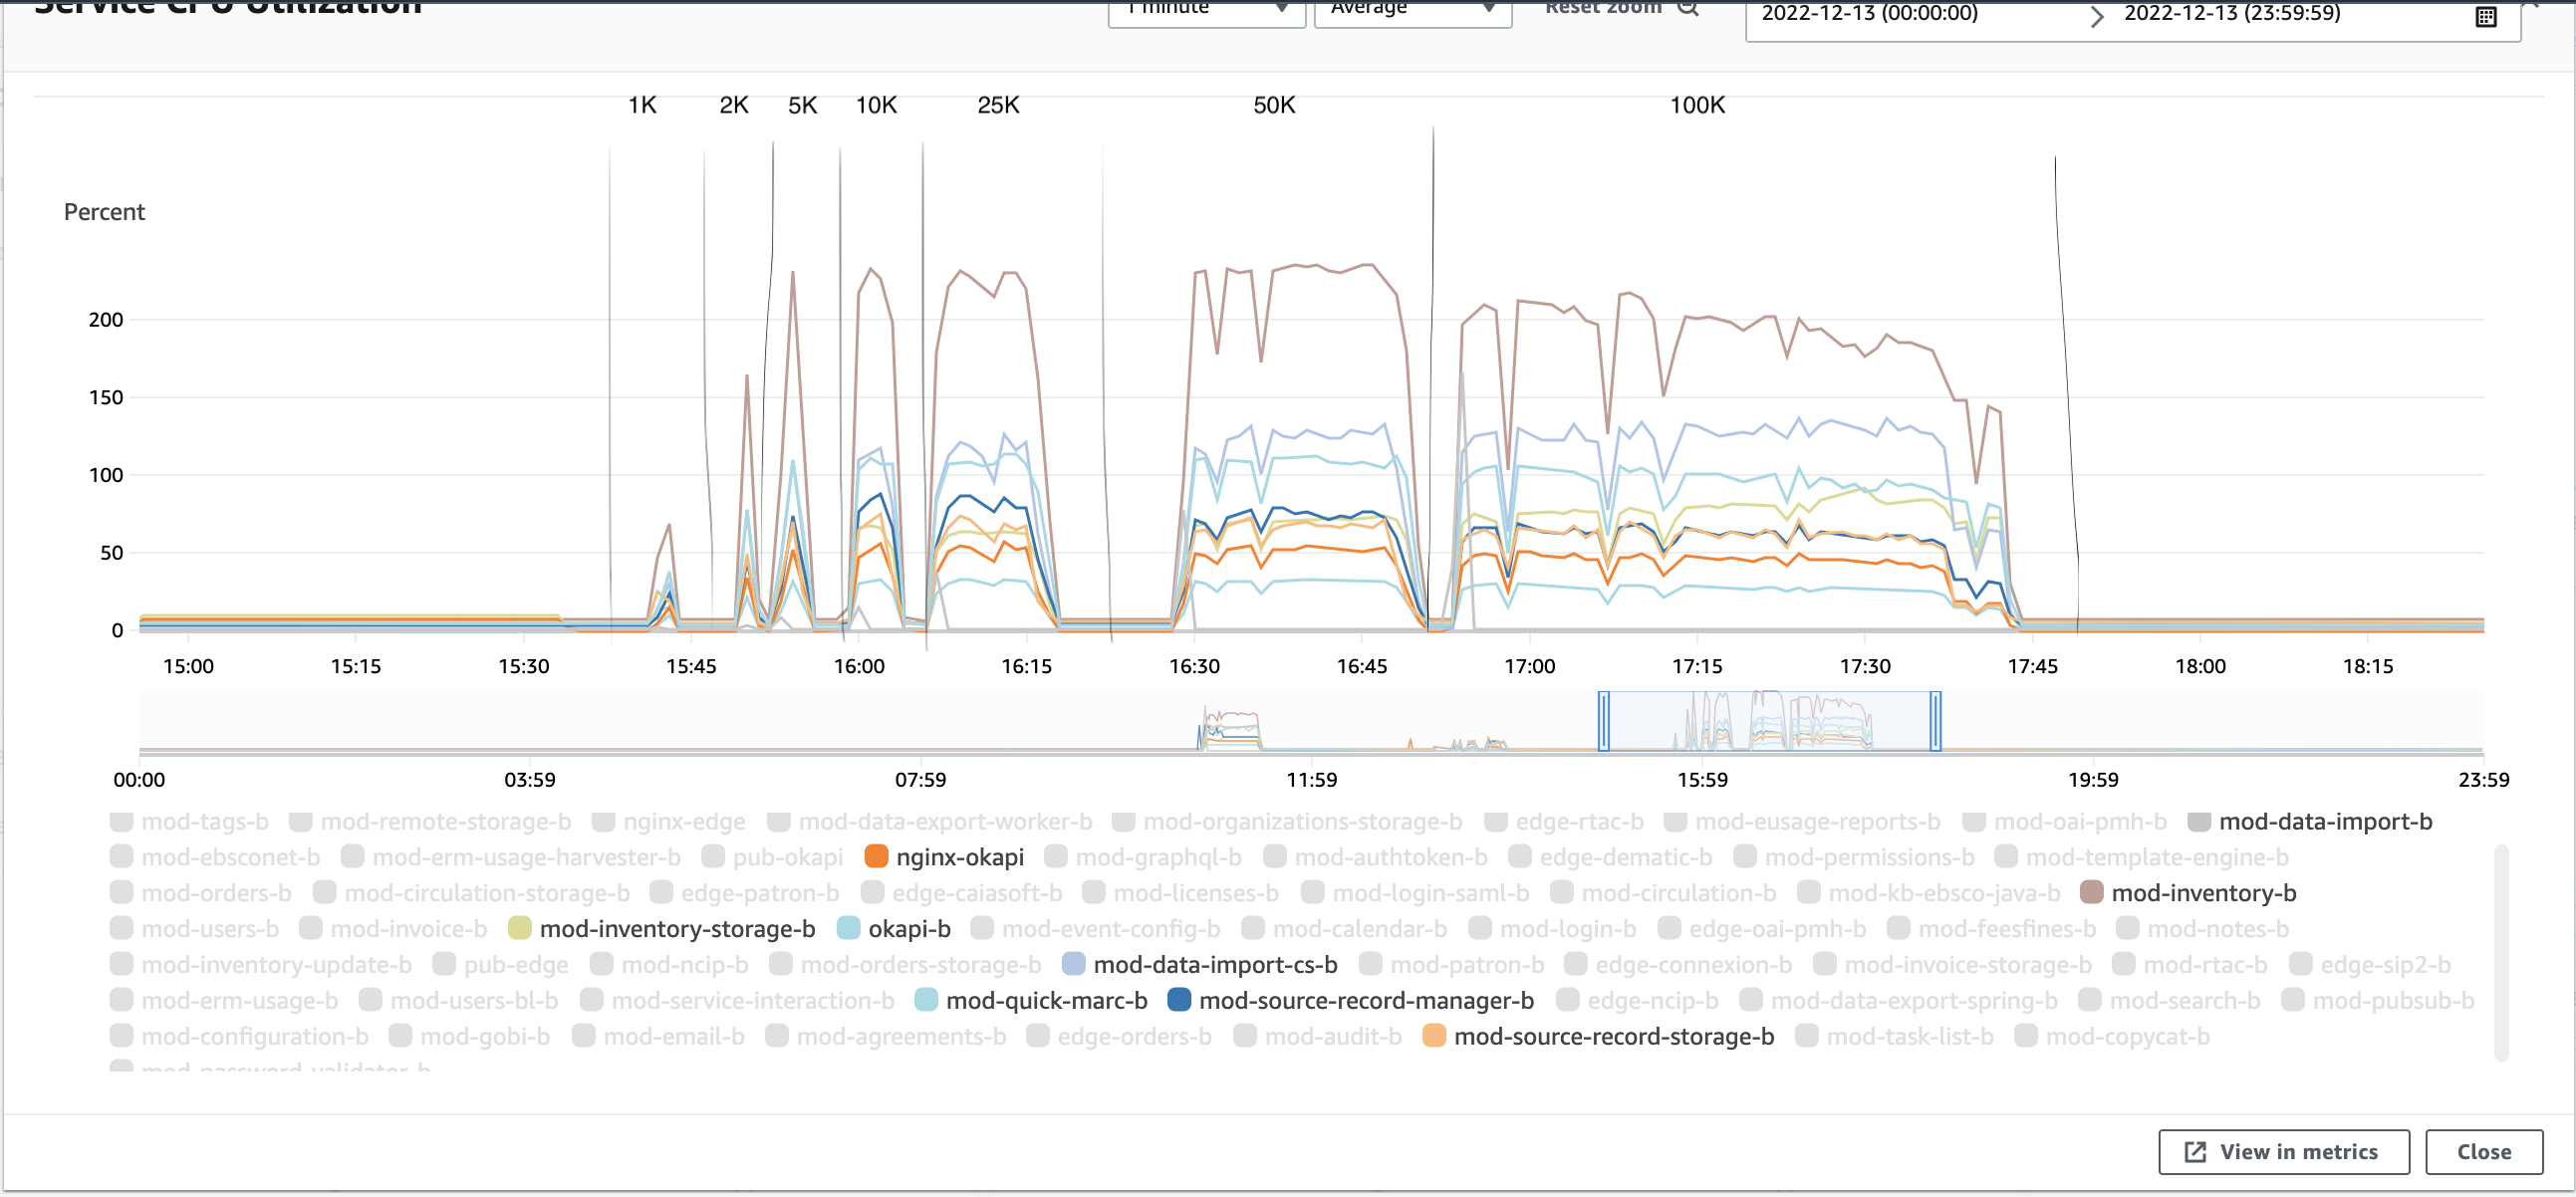
Service CPU usage
Service memory usage
Instance level CPU usage
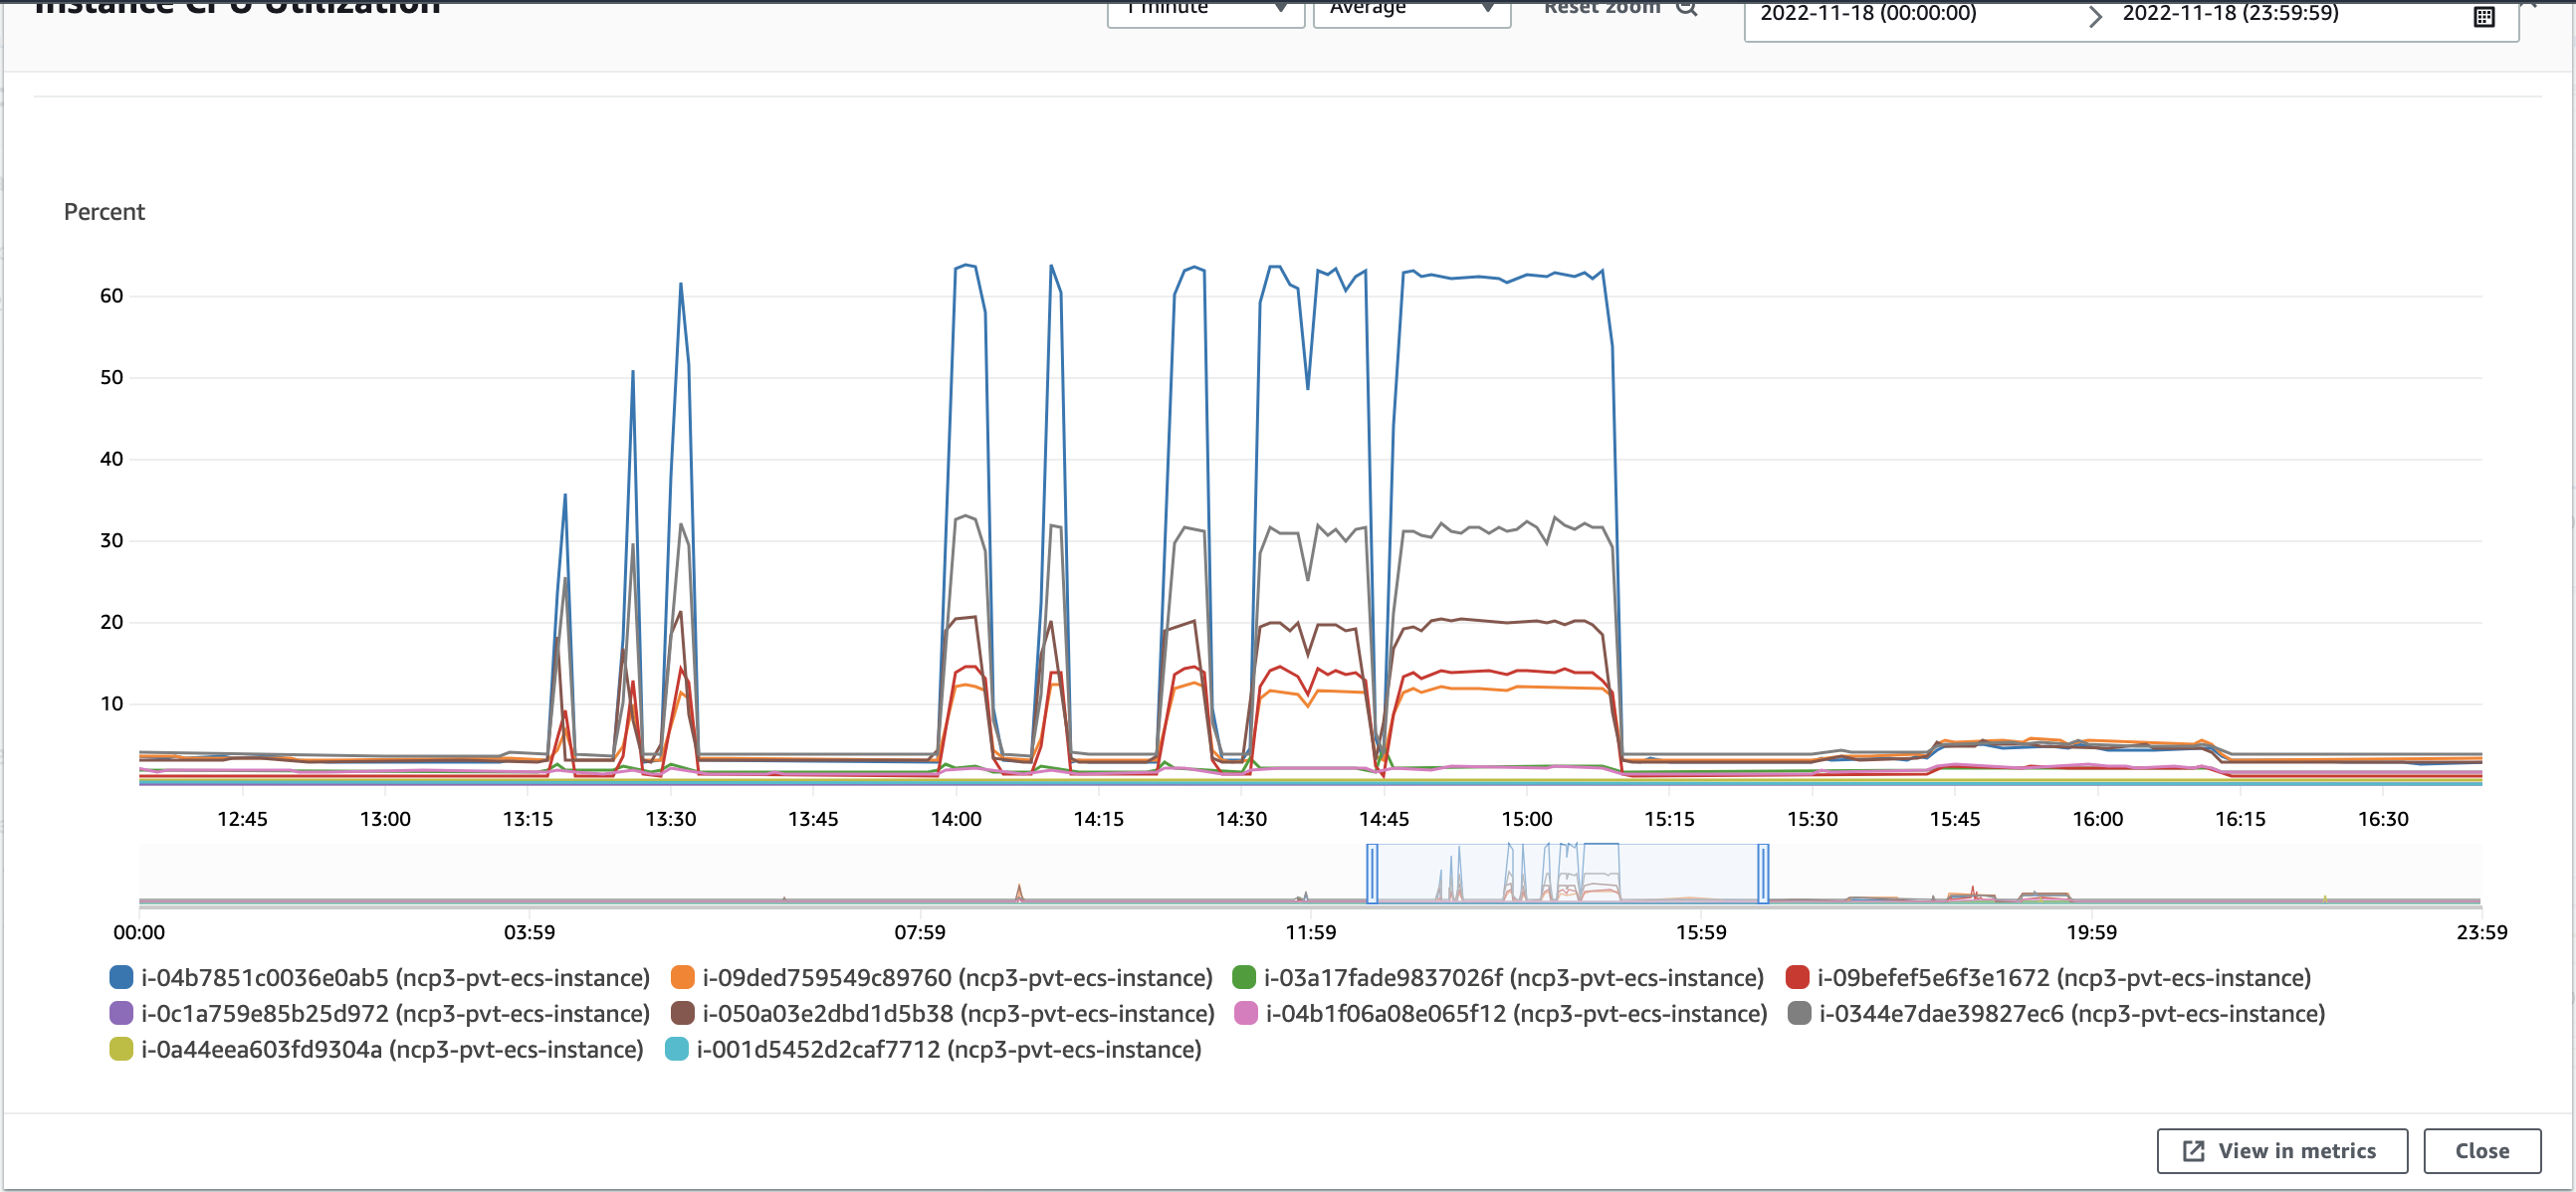
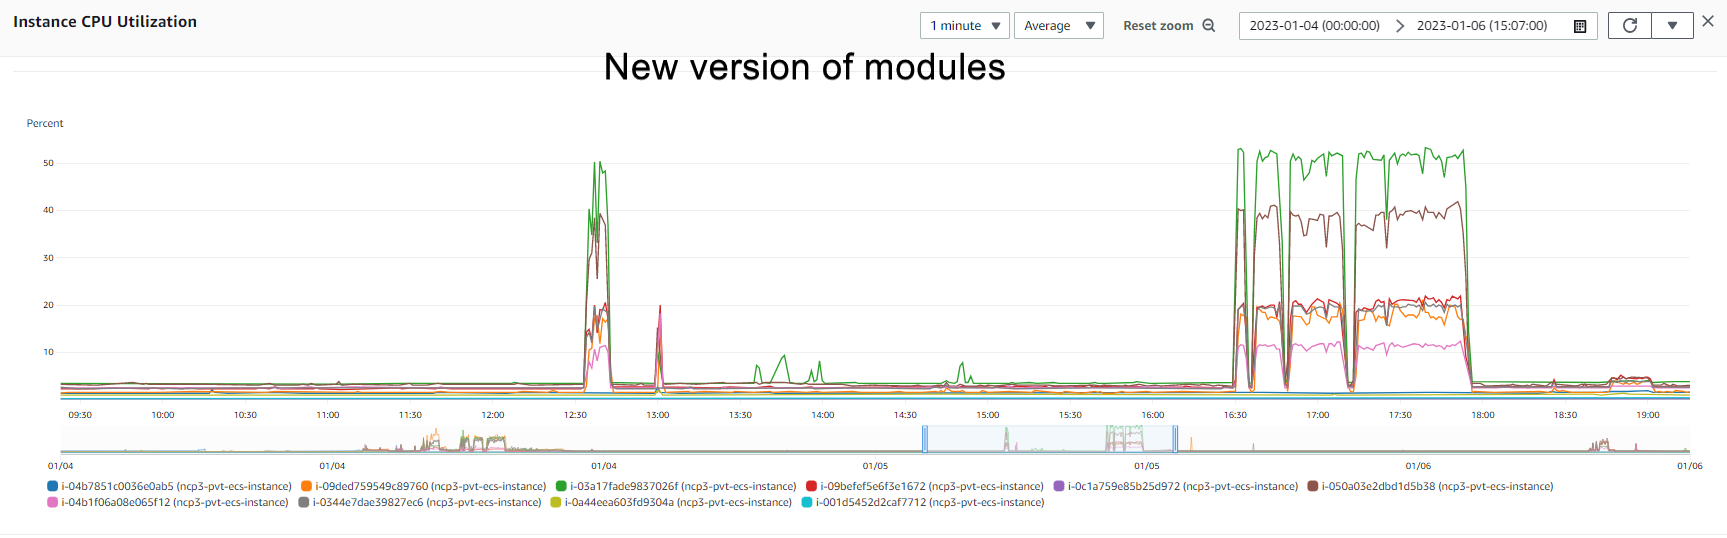
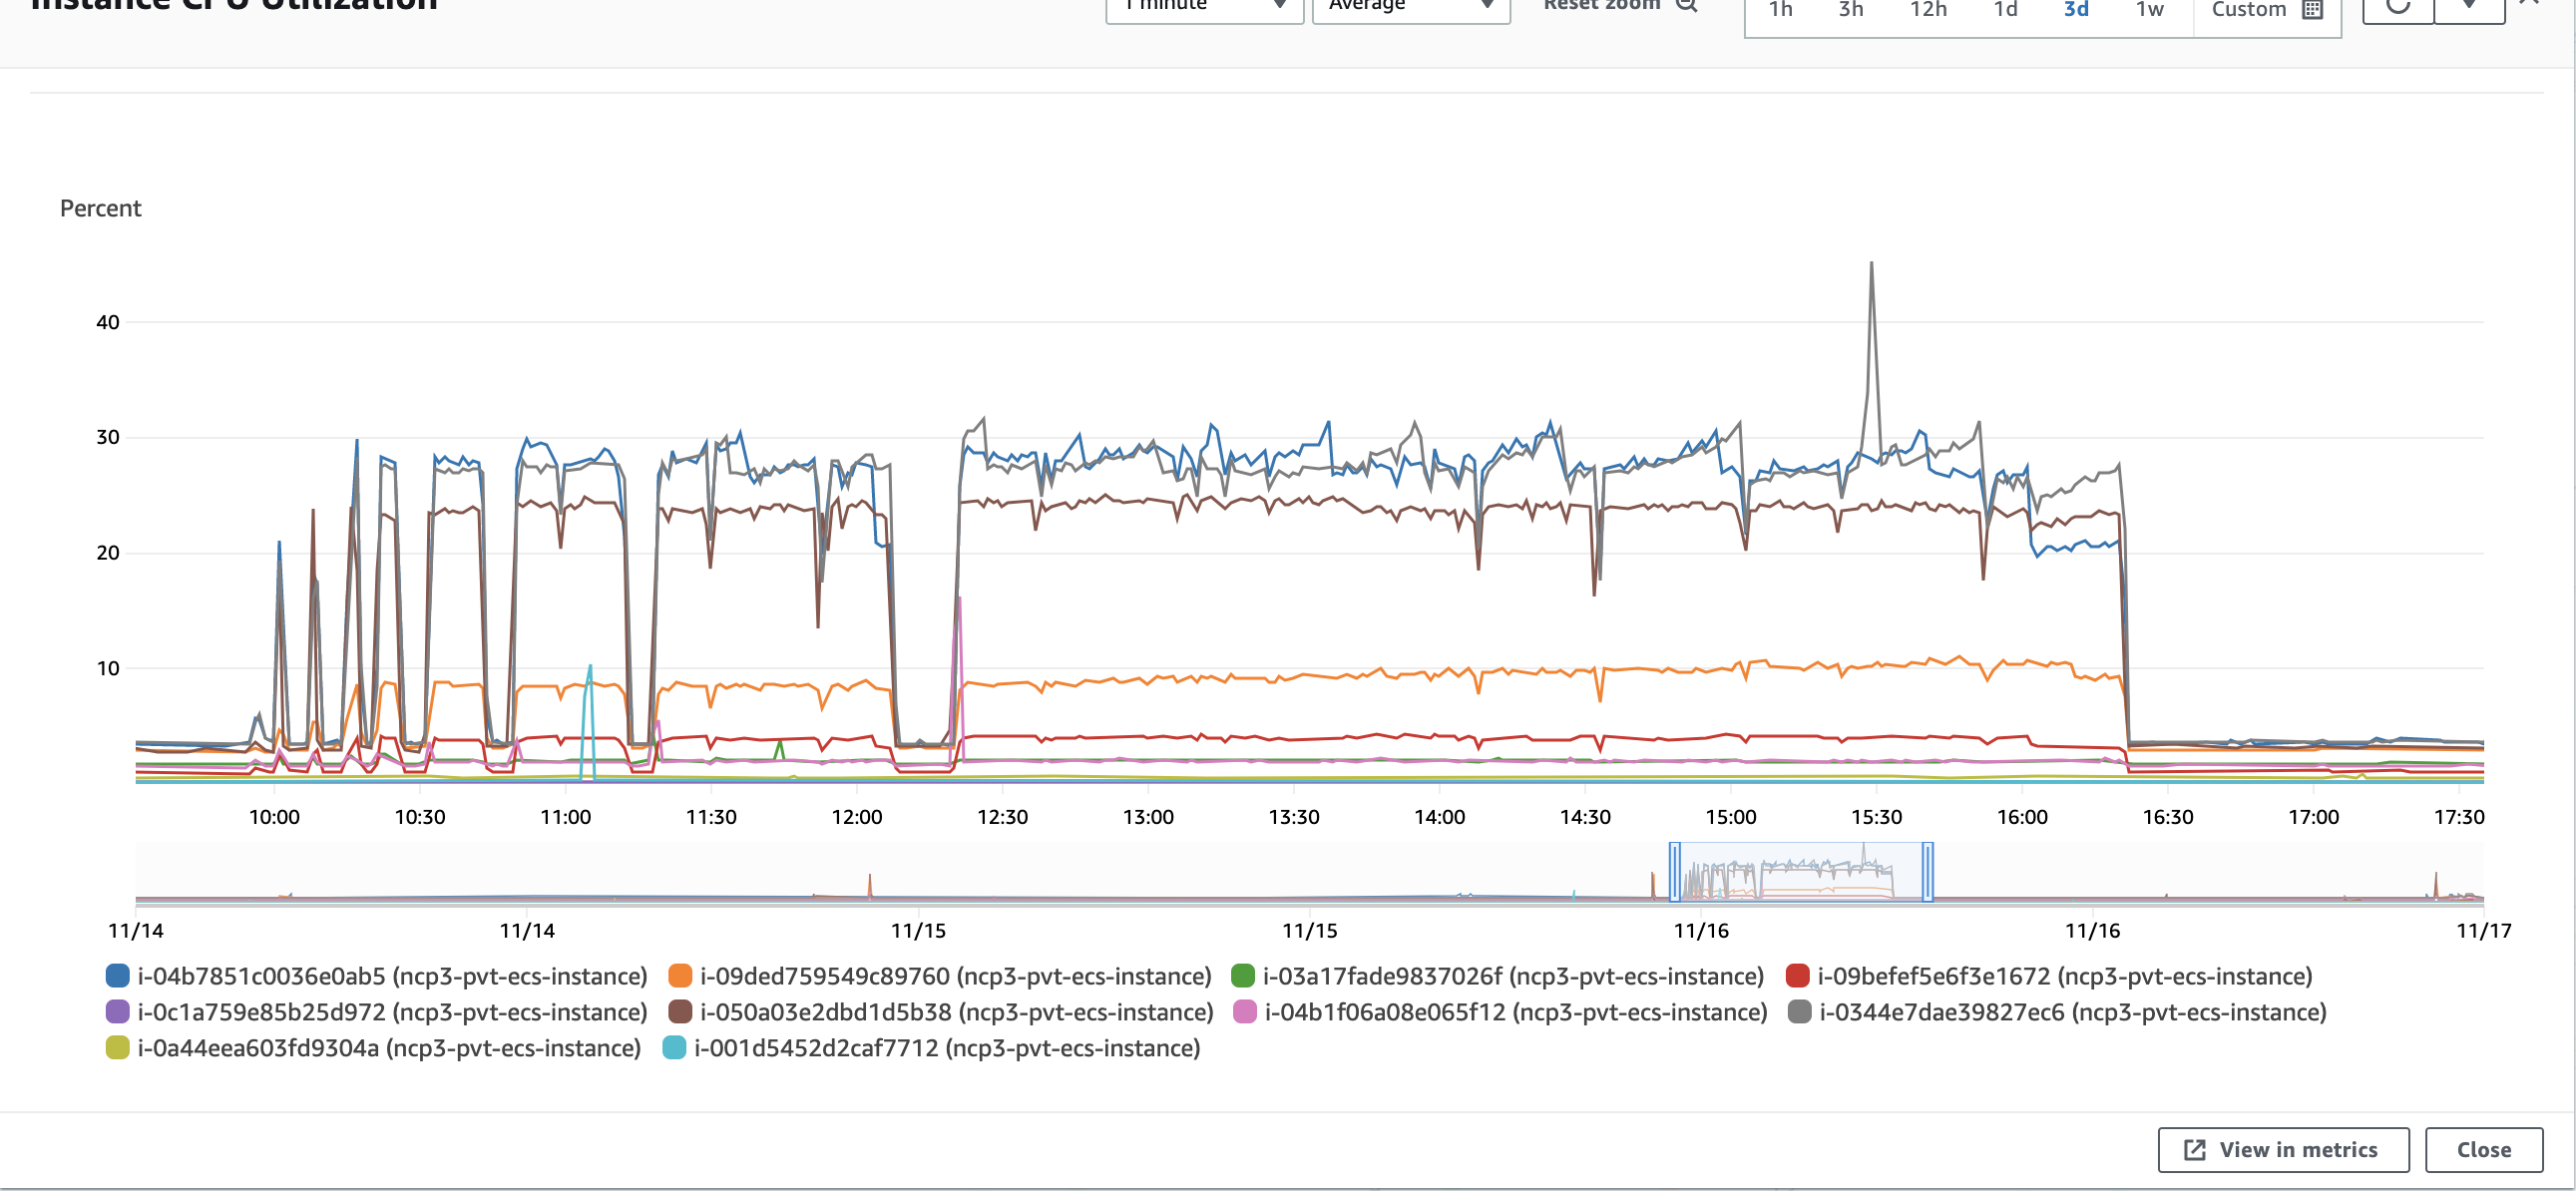
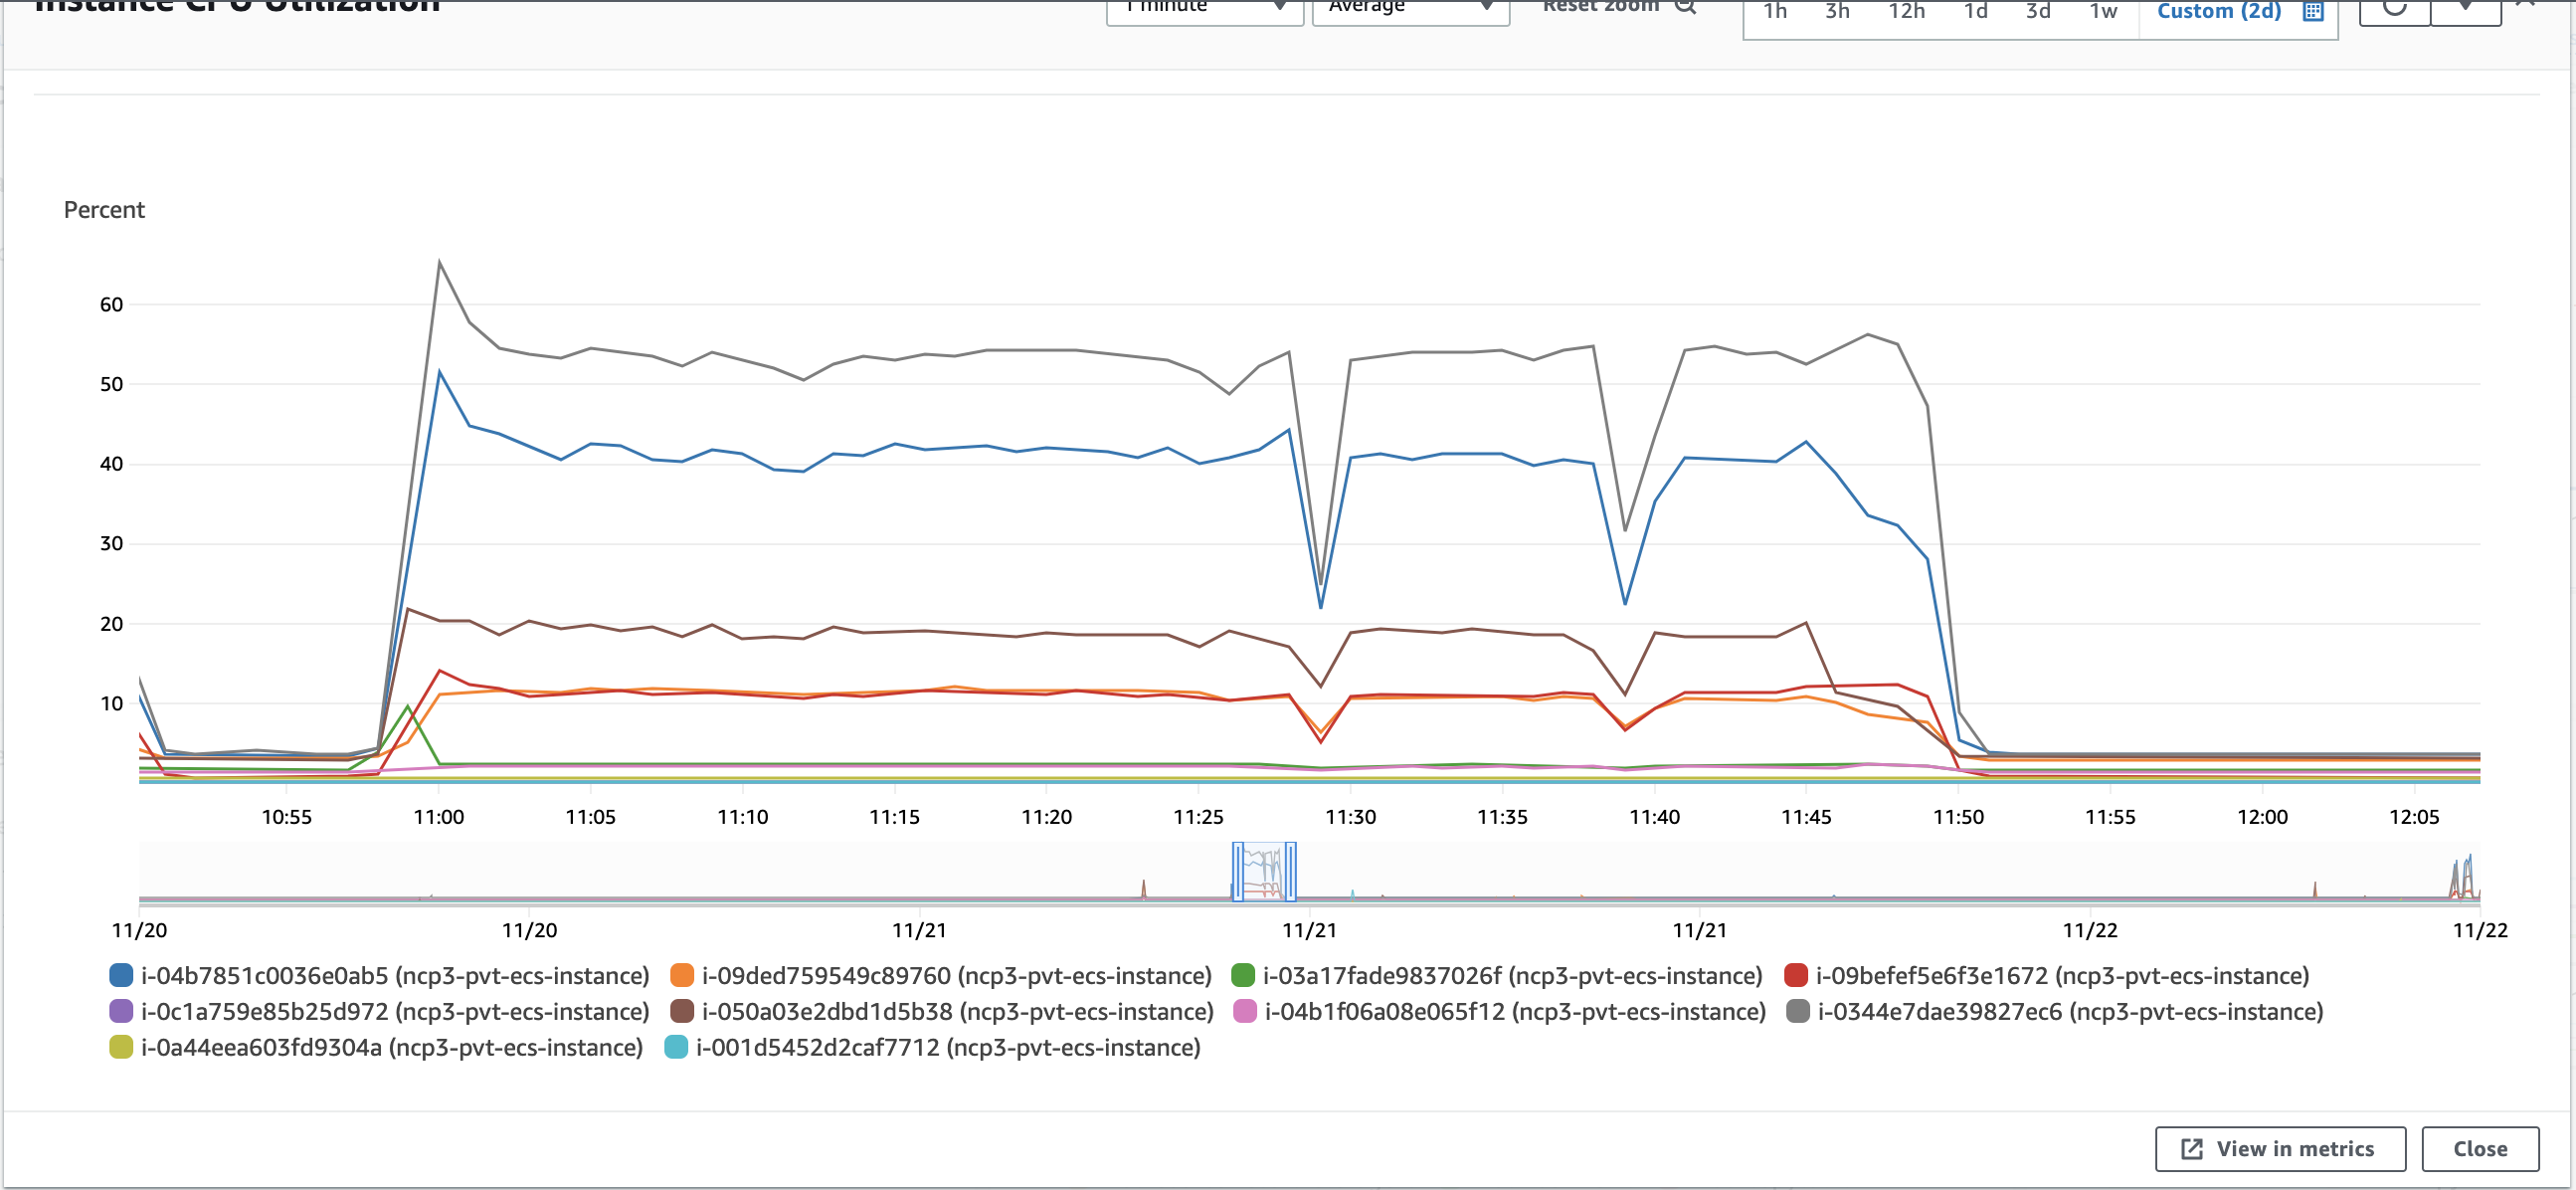
Note: In comparison to Morning Glory release instance CPU level is higher by 20% on one of the instances. However it can be explained with another distribution of containers on instances.
100 K Update
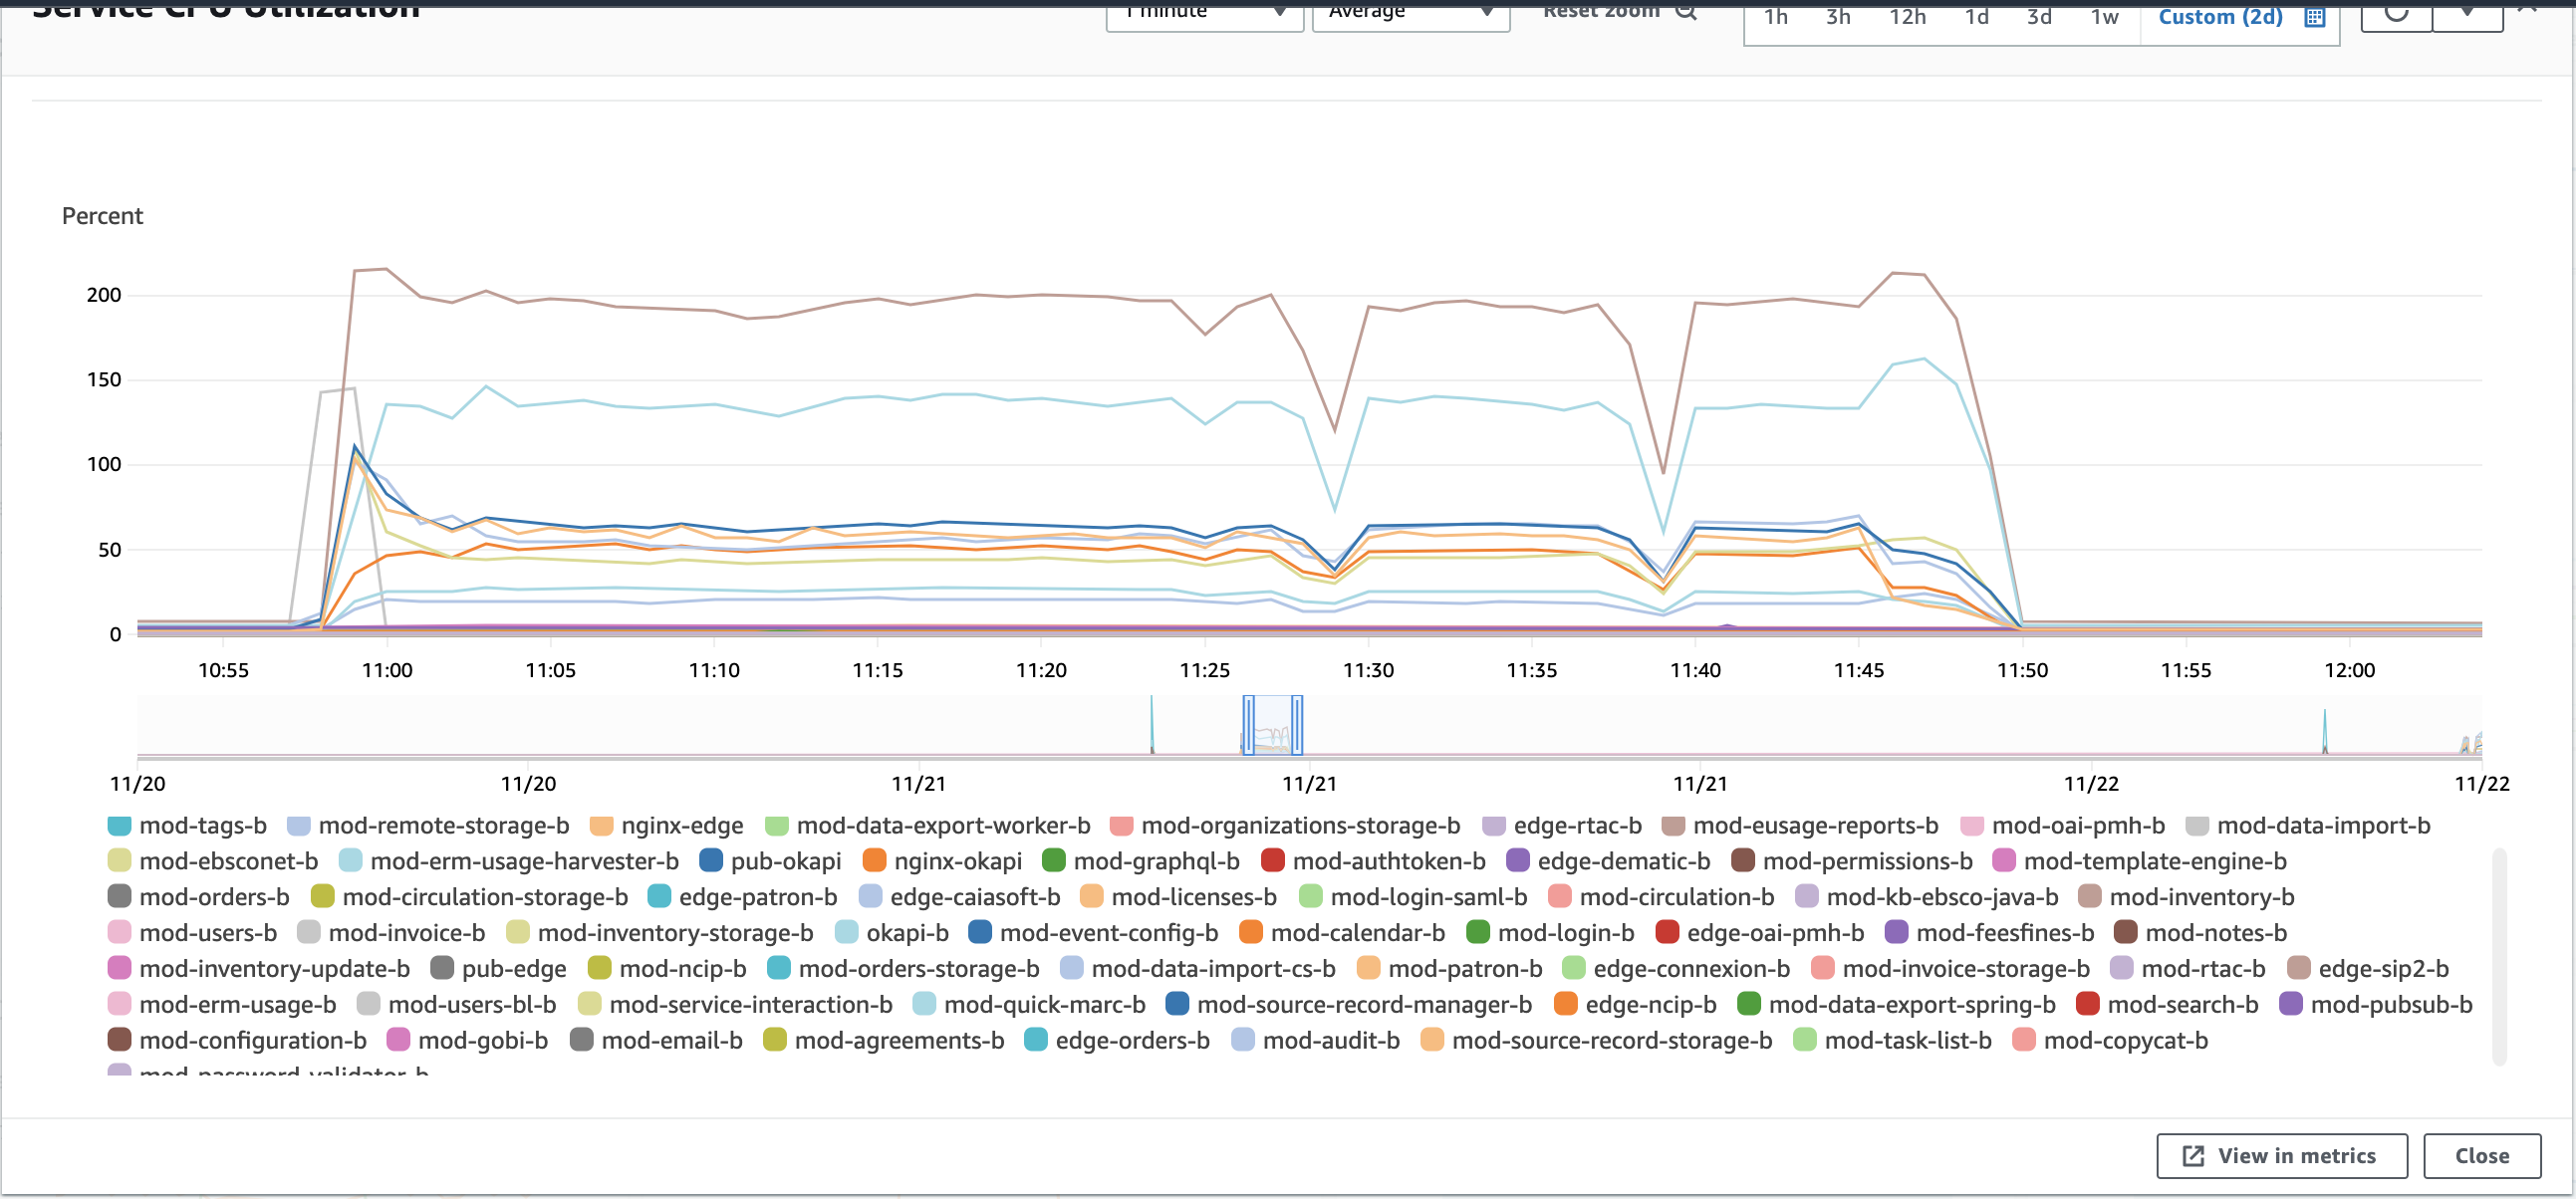
Service CPU usage
Service memory usage
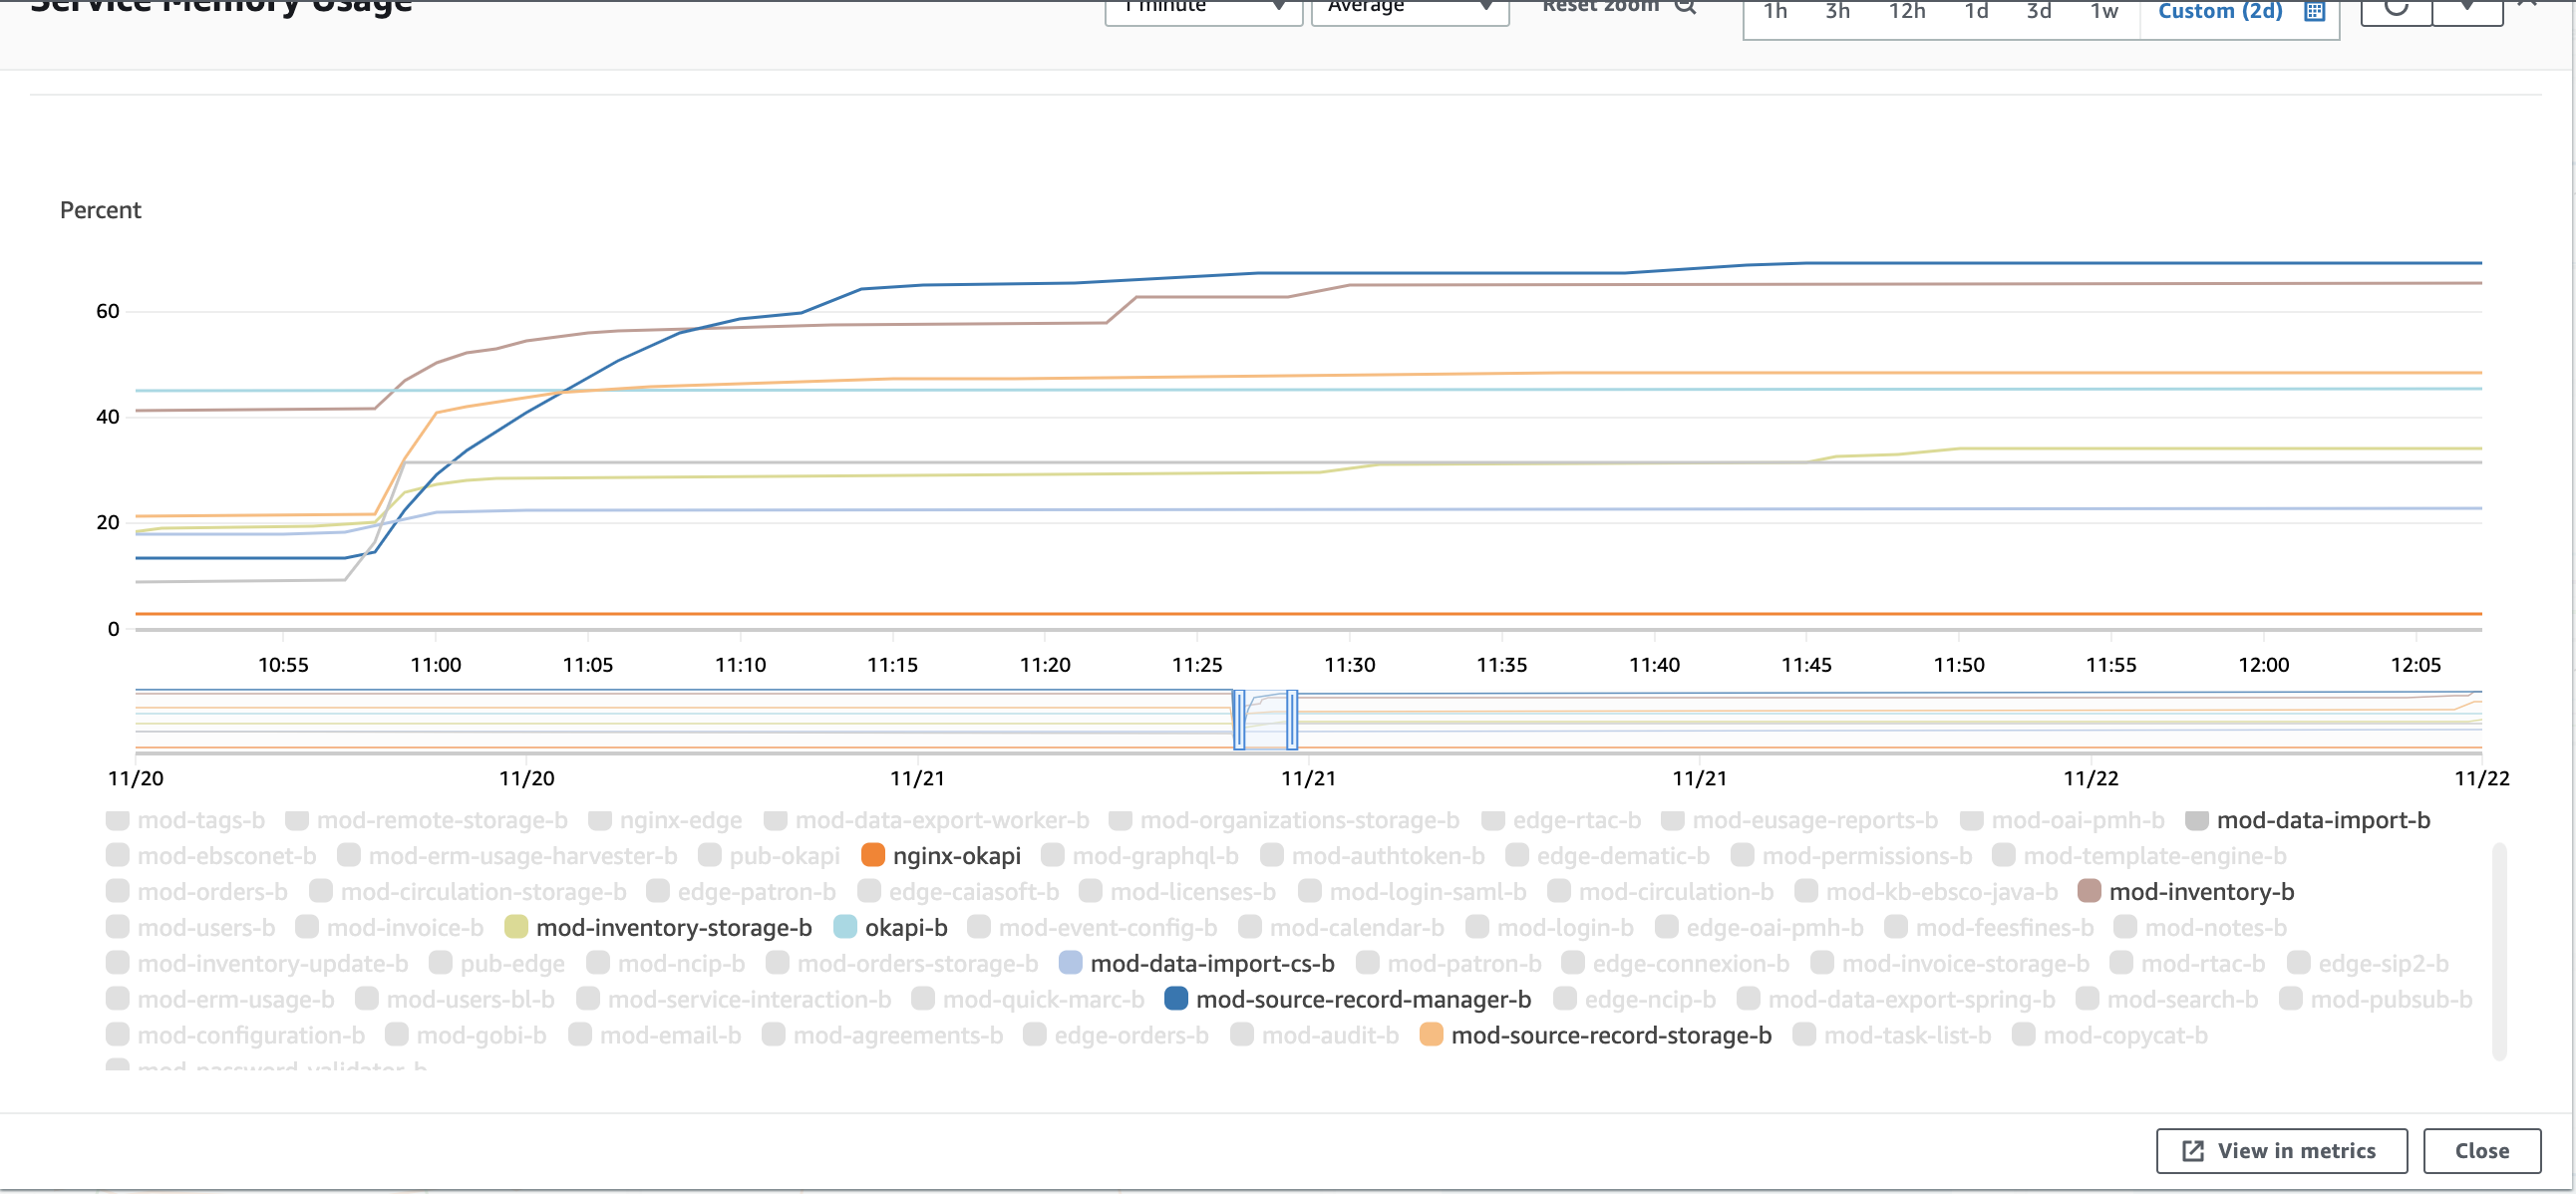
Note: Here is the same growing of memory usage as was in previous tests, ticket to investigate: PERF-358
Update: After additional investigation in scope of PERF-358 we can say that there is no memory leaks in any of the modules. For most of them memory will grow up to some point and then stop growing. See details in ticket.
Instance level CPU usage
DB CPU usage
Read Write Split enabled
Note:R/W was enabled for:
- mod-inventory-storage
- mod-source-record-manager
- source-record-storage
- mod-data-import
- mod-data-import-cs
Duration With RW split | Duration Nolana | ||
|---|---|---|---|
| 1K MARC Create | PTF - Create 2 | 48 s | 46 s |
1K MARC Update | PTF - Updates Success - 1 | 1 min 1 s | 50 s |
| 2K MARC Create | PTF - Create 2 | 1 min 9 s | 1 min 13 s |
| 2K MARC Update | PTF - Updates Success - 1 | 58 s | 1 min 7 s |
5K MARC Create | PTF - Create 2 | 2 min 4 s | 2 min 51 s |
| 5K MARC Update | PTF - Updates Success - 1 | 2 min 7 s | 2 min 27s |
10K MARC Create | PTF - Create 2 | 3 min 43 s | 4 min 55 s |
| 10K MARC Update | PTF - Updates Success - 1 | 4 min 8 s | 4 min 50 s |
| 25K MARC Create | PTF - Create 2 | 8 min 58 s | 11 min 56 s |
| 25K MARC Update | PTF - Updates Success - 1 | 10 min 46 s | 12 min 20 s |
| 50K MARC Create | PTF - Create 2 | 18 min 2 s | 23 min 43 s |
50K MARC Update | PTF - Updates Success - 1 | 22 min 22 s | 24 min 5 s |
| 100K MARC Create | PTF - Create 2 | 35 min 4 s | 49 min 40 s |
100K MARC Update | PTF - Updates Success - 1 | 50 min 19 s | 51 min 15 s |
Resources usage "creates"
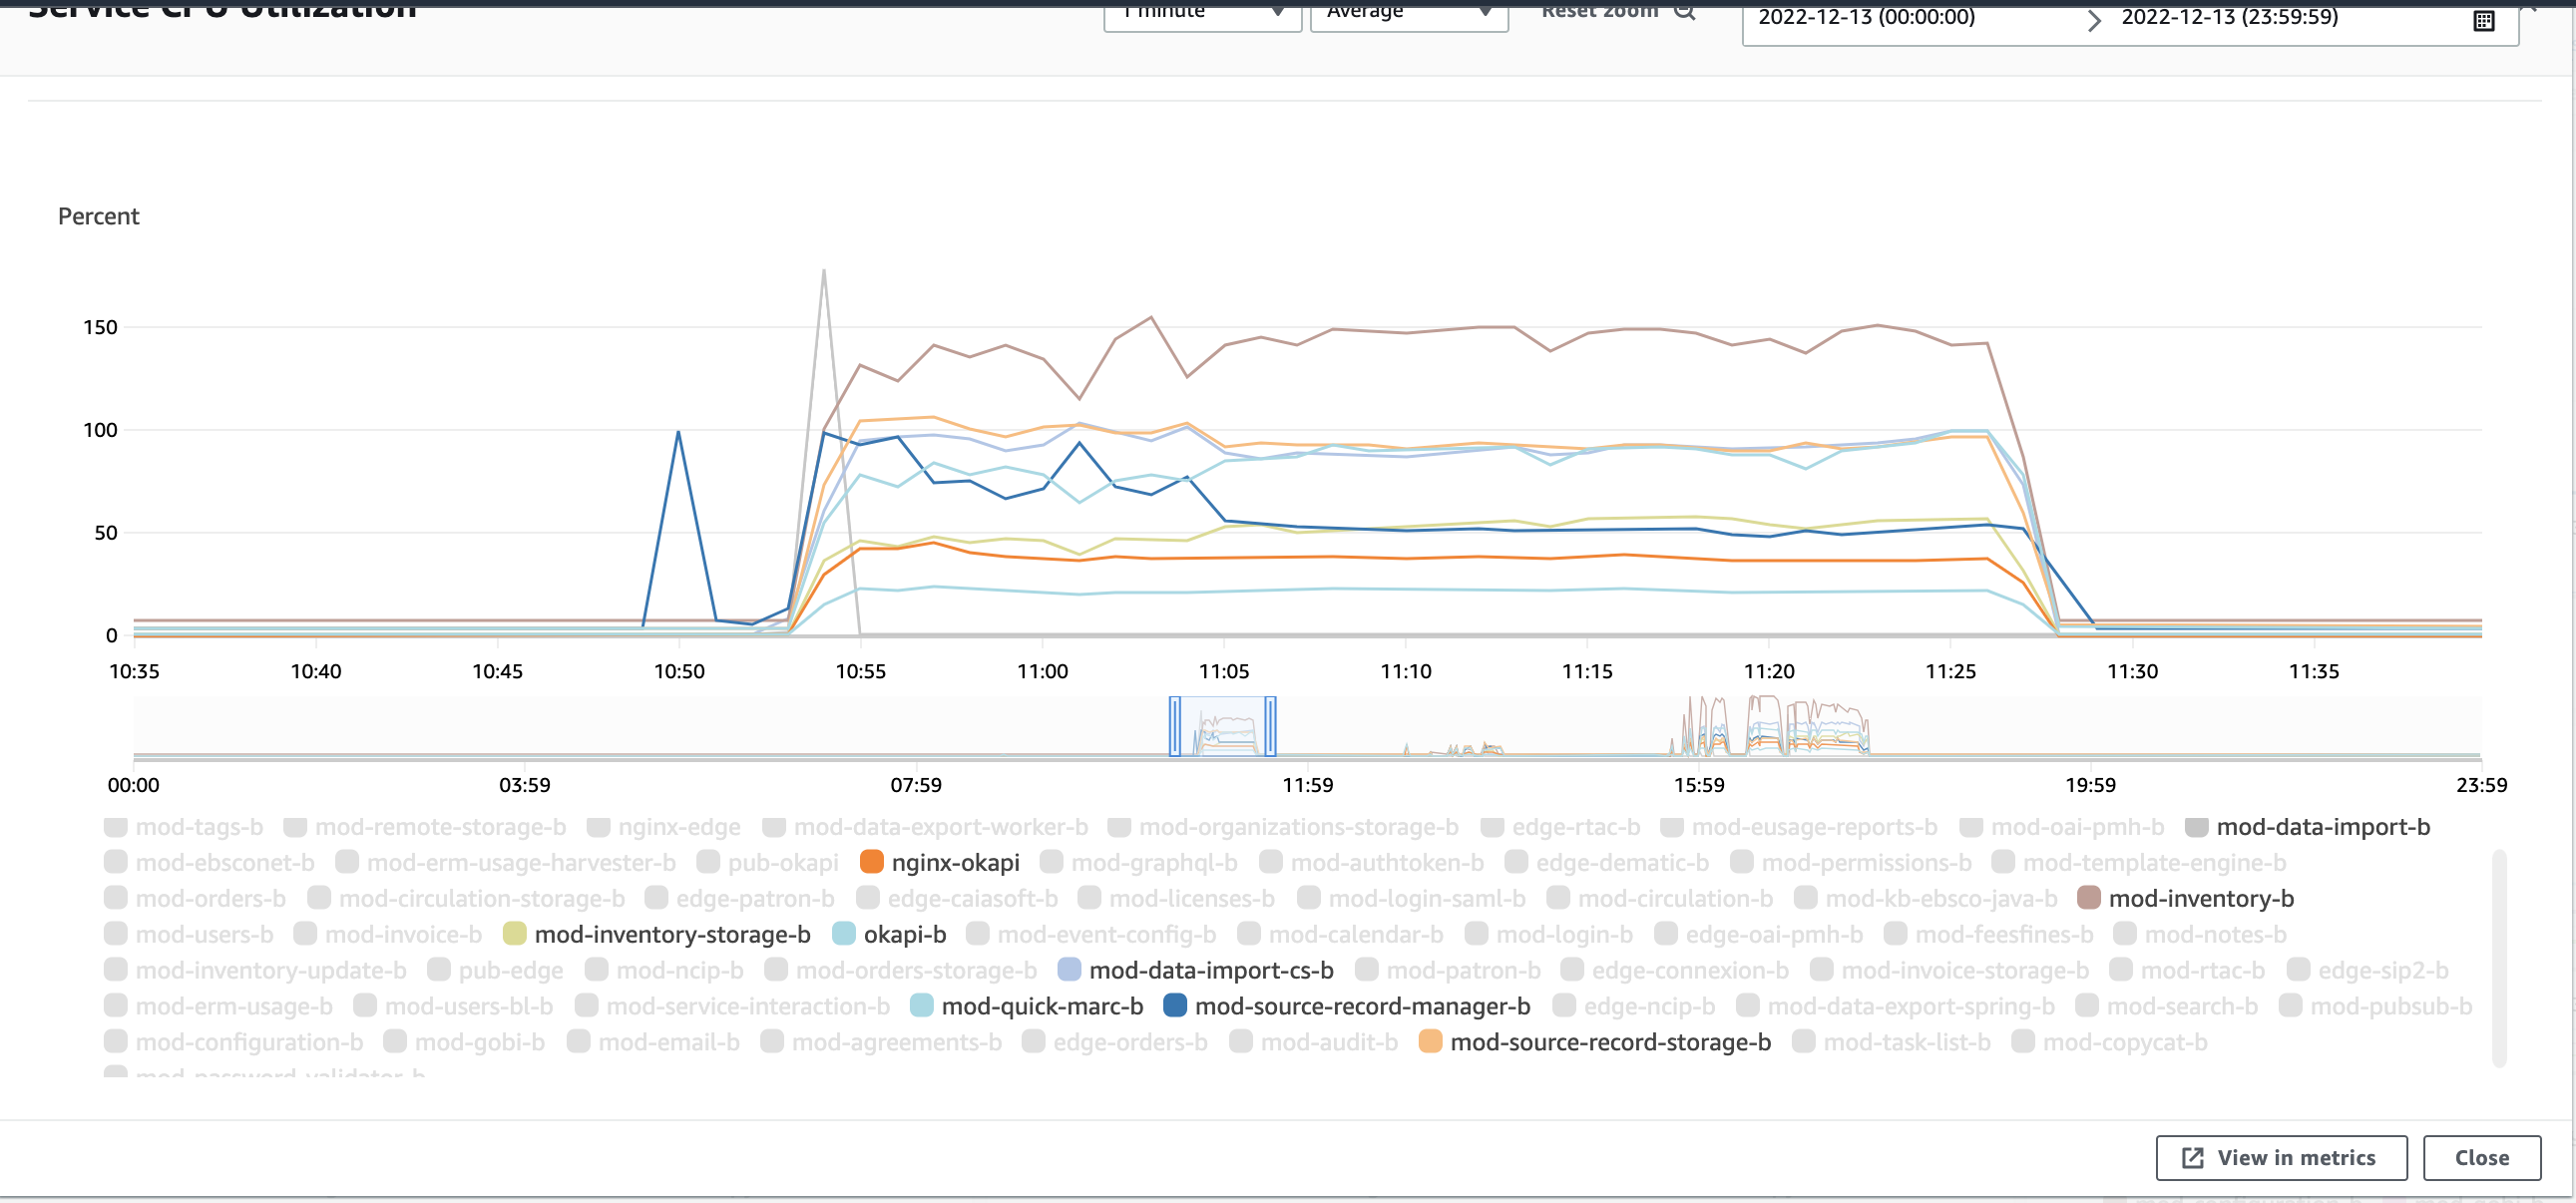
Service CPU usage

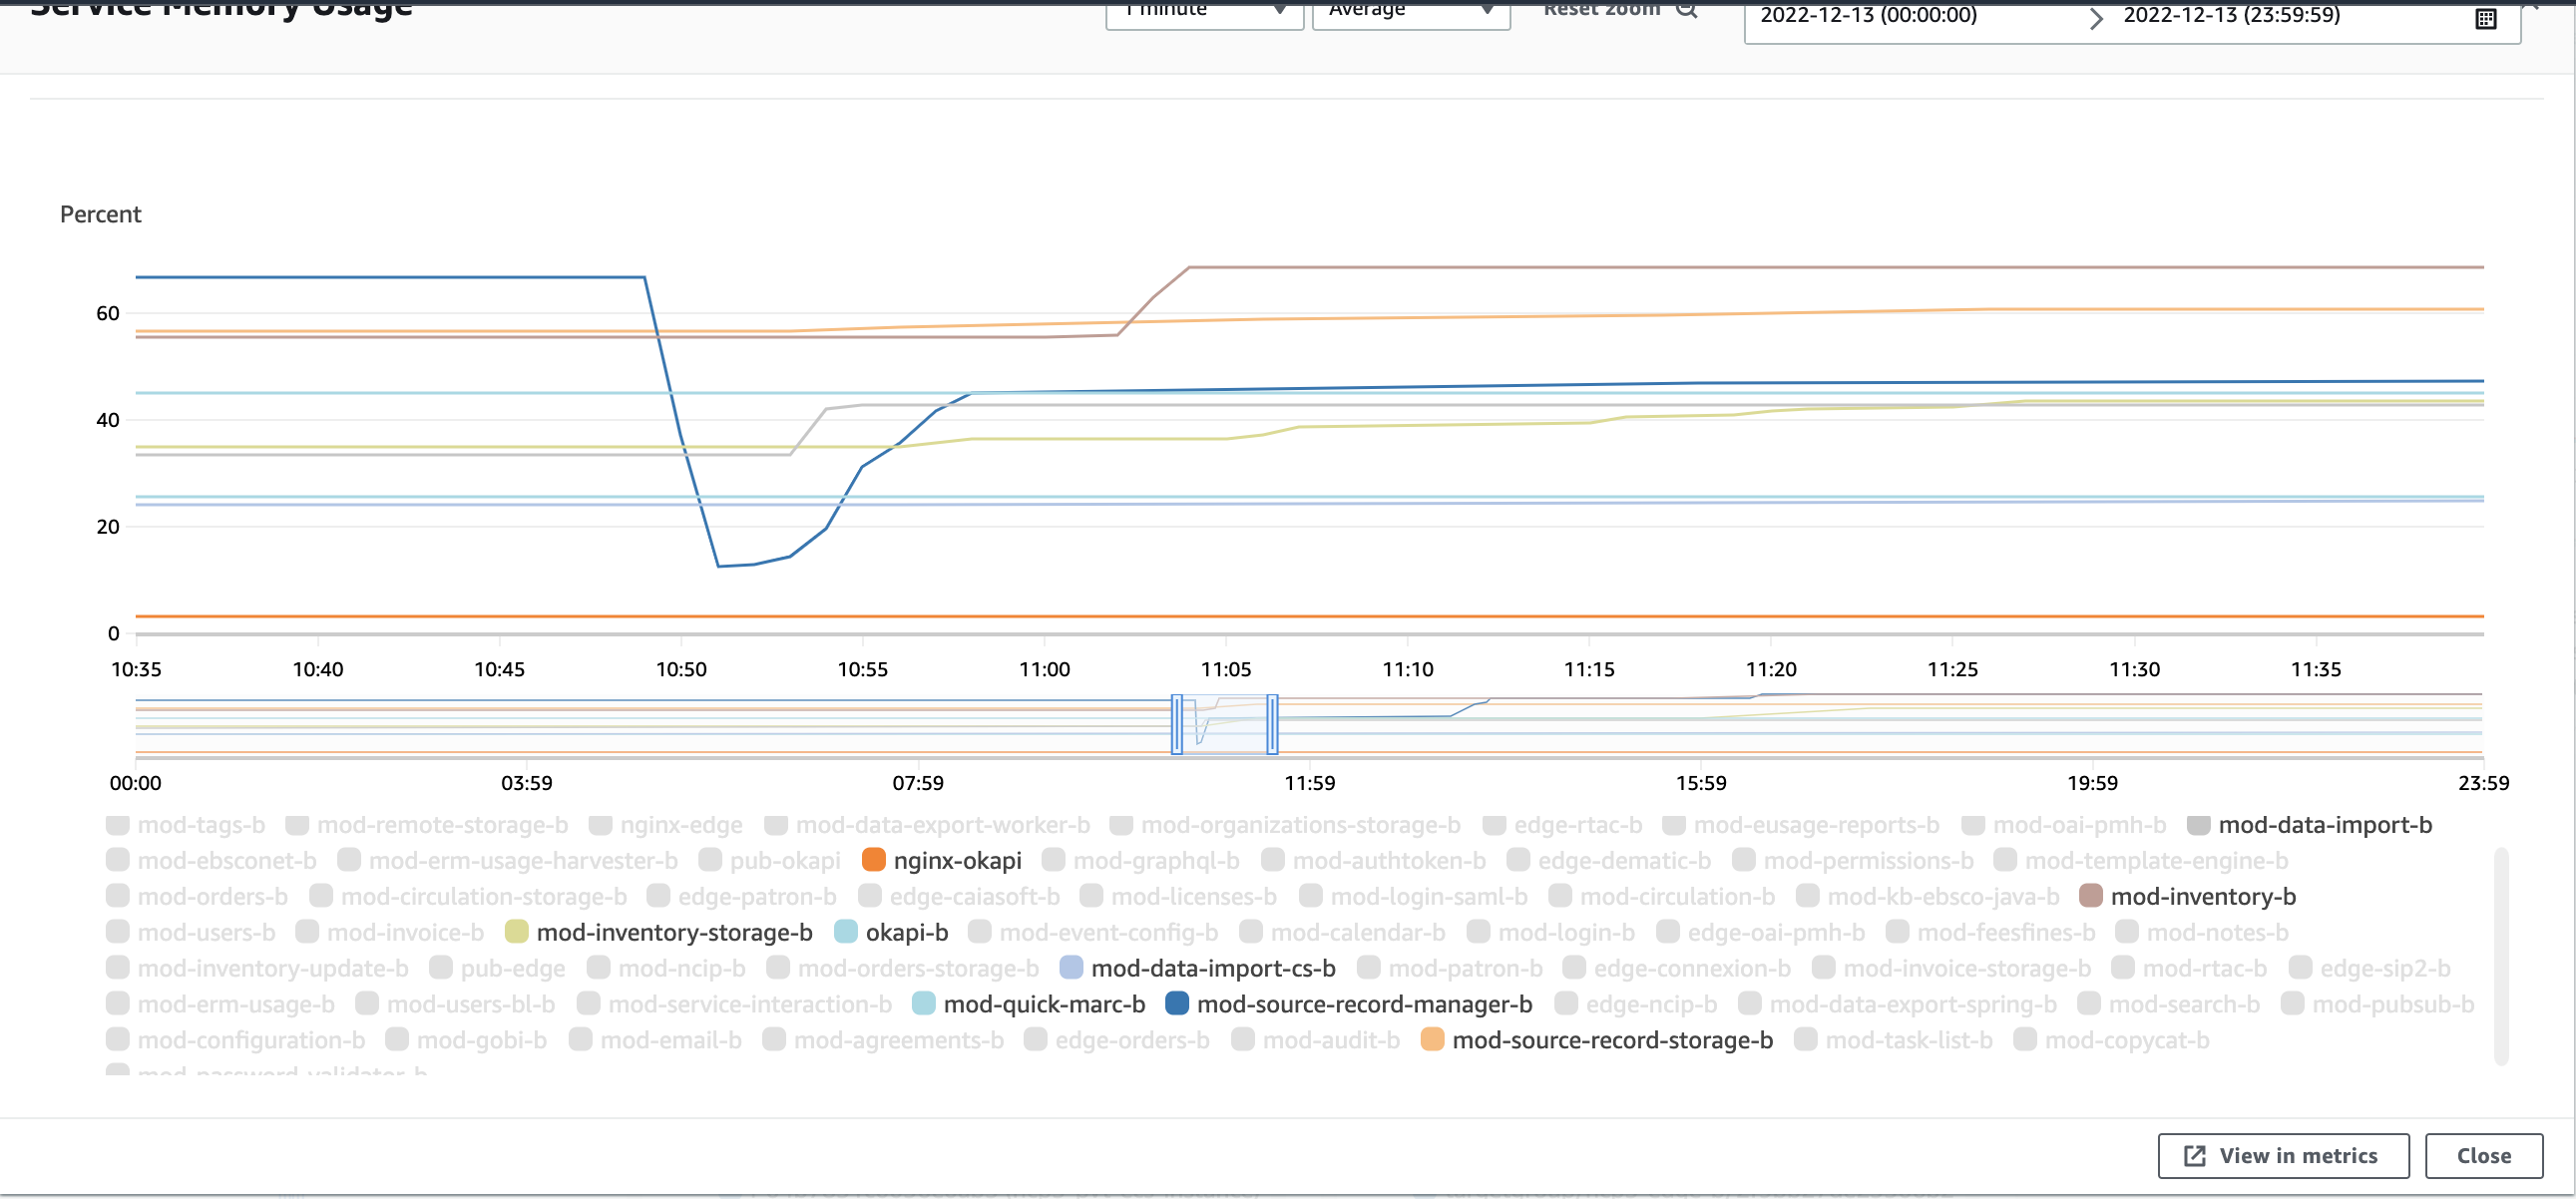
Service Memory Utilization
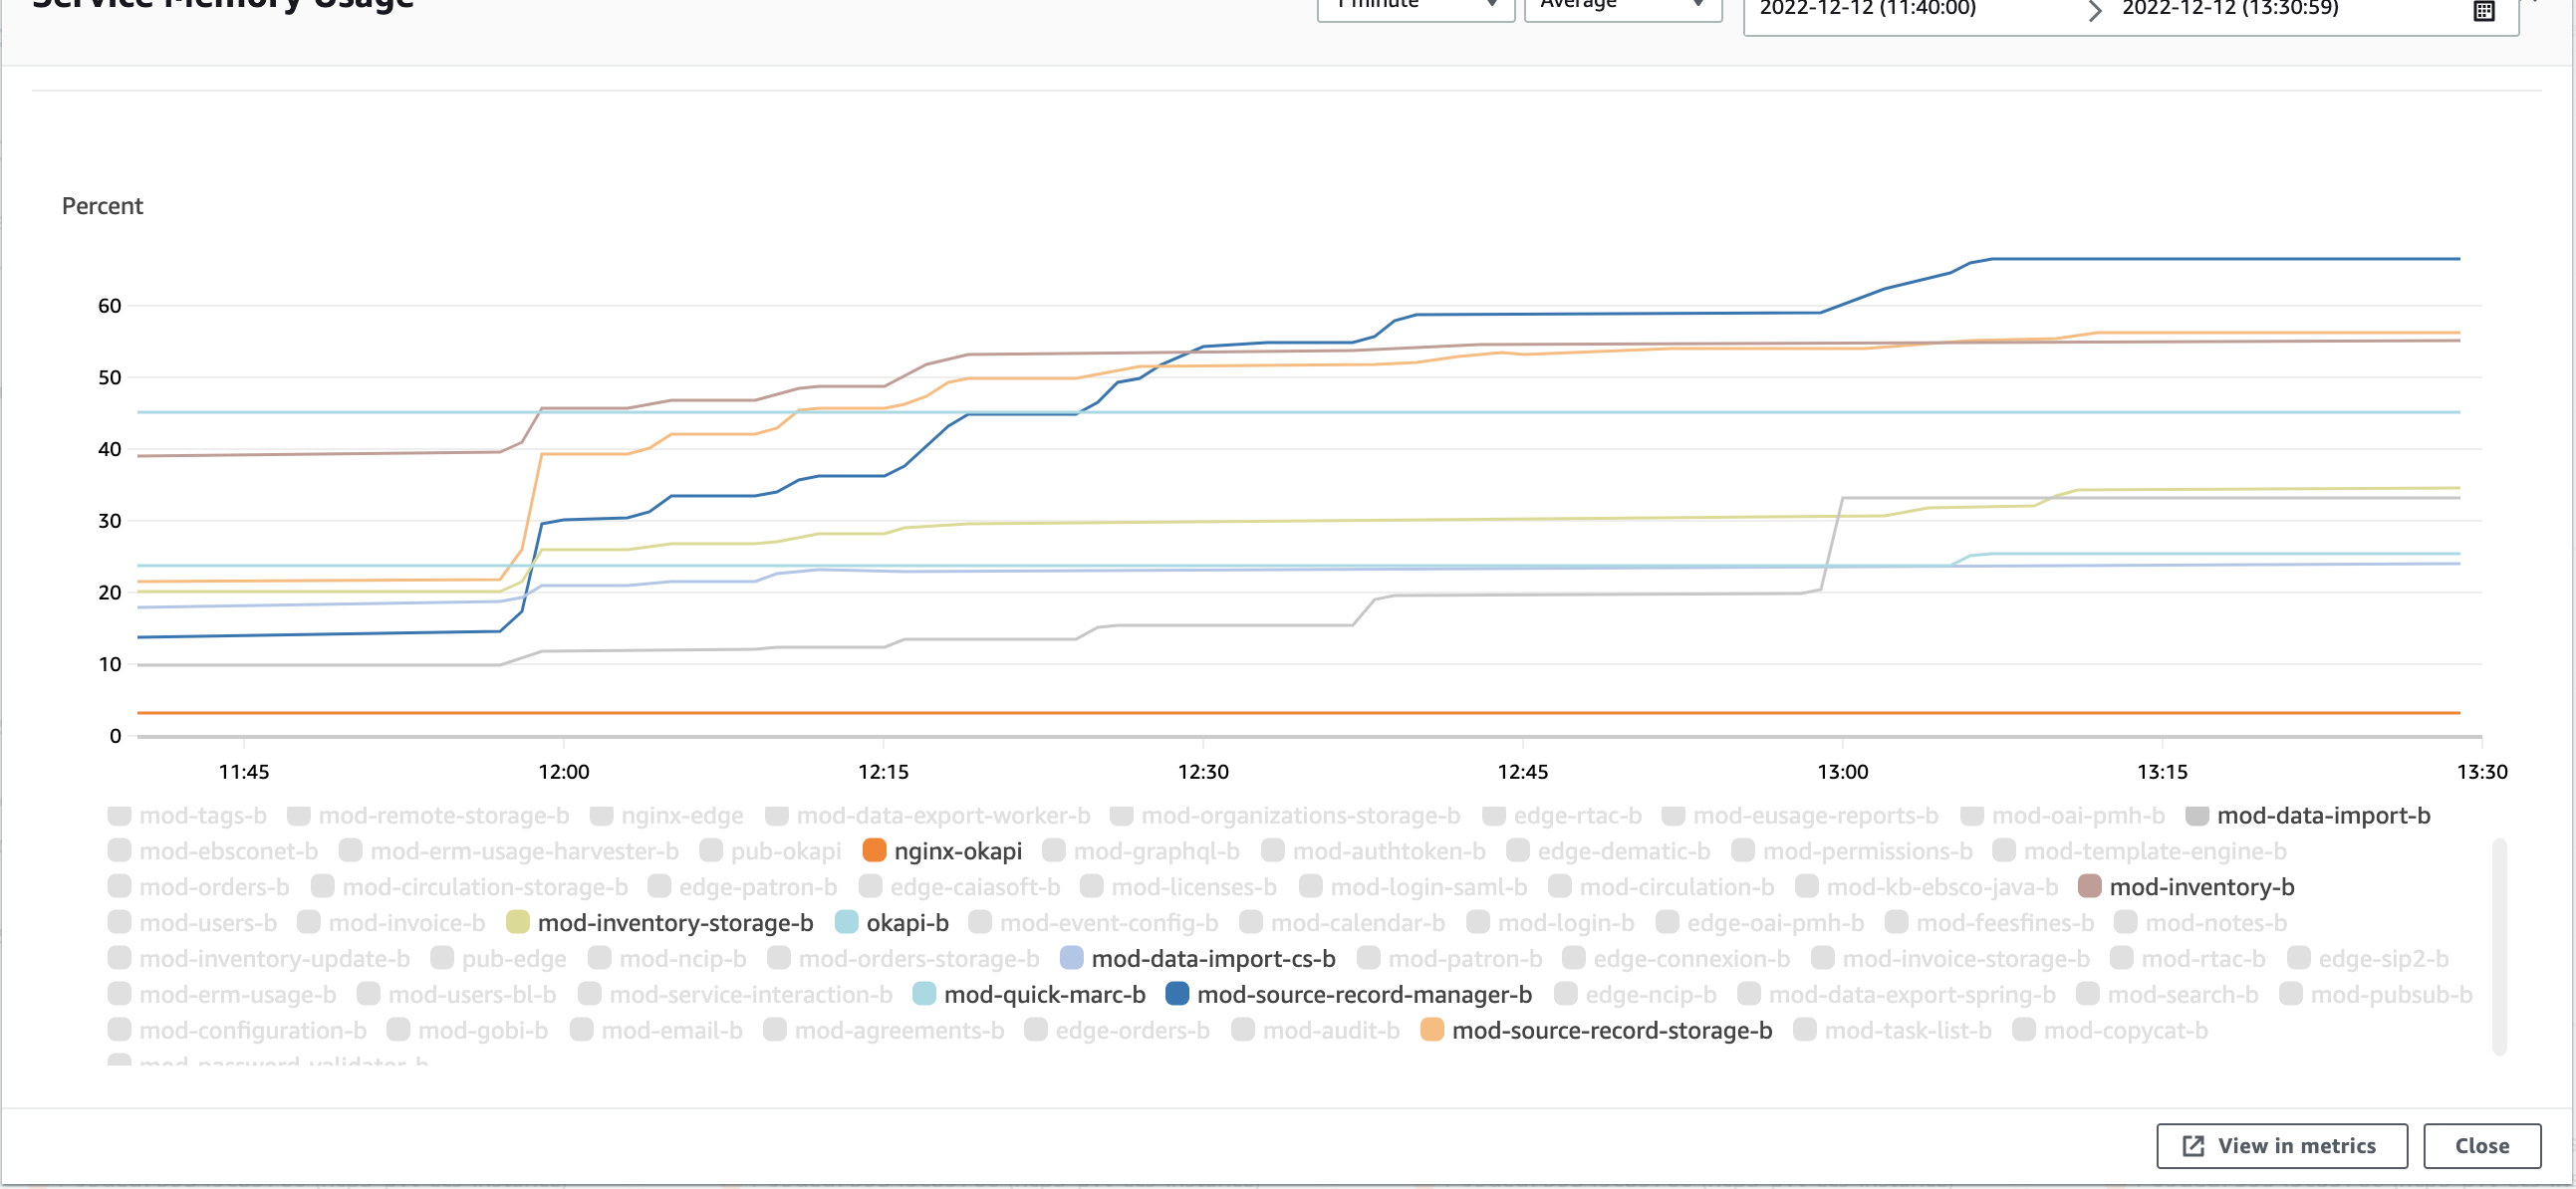
Note: All tests were performed on "fresh" modules this can explain growing memory usage on modules. They will stop growing memory according to PERF-358
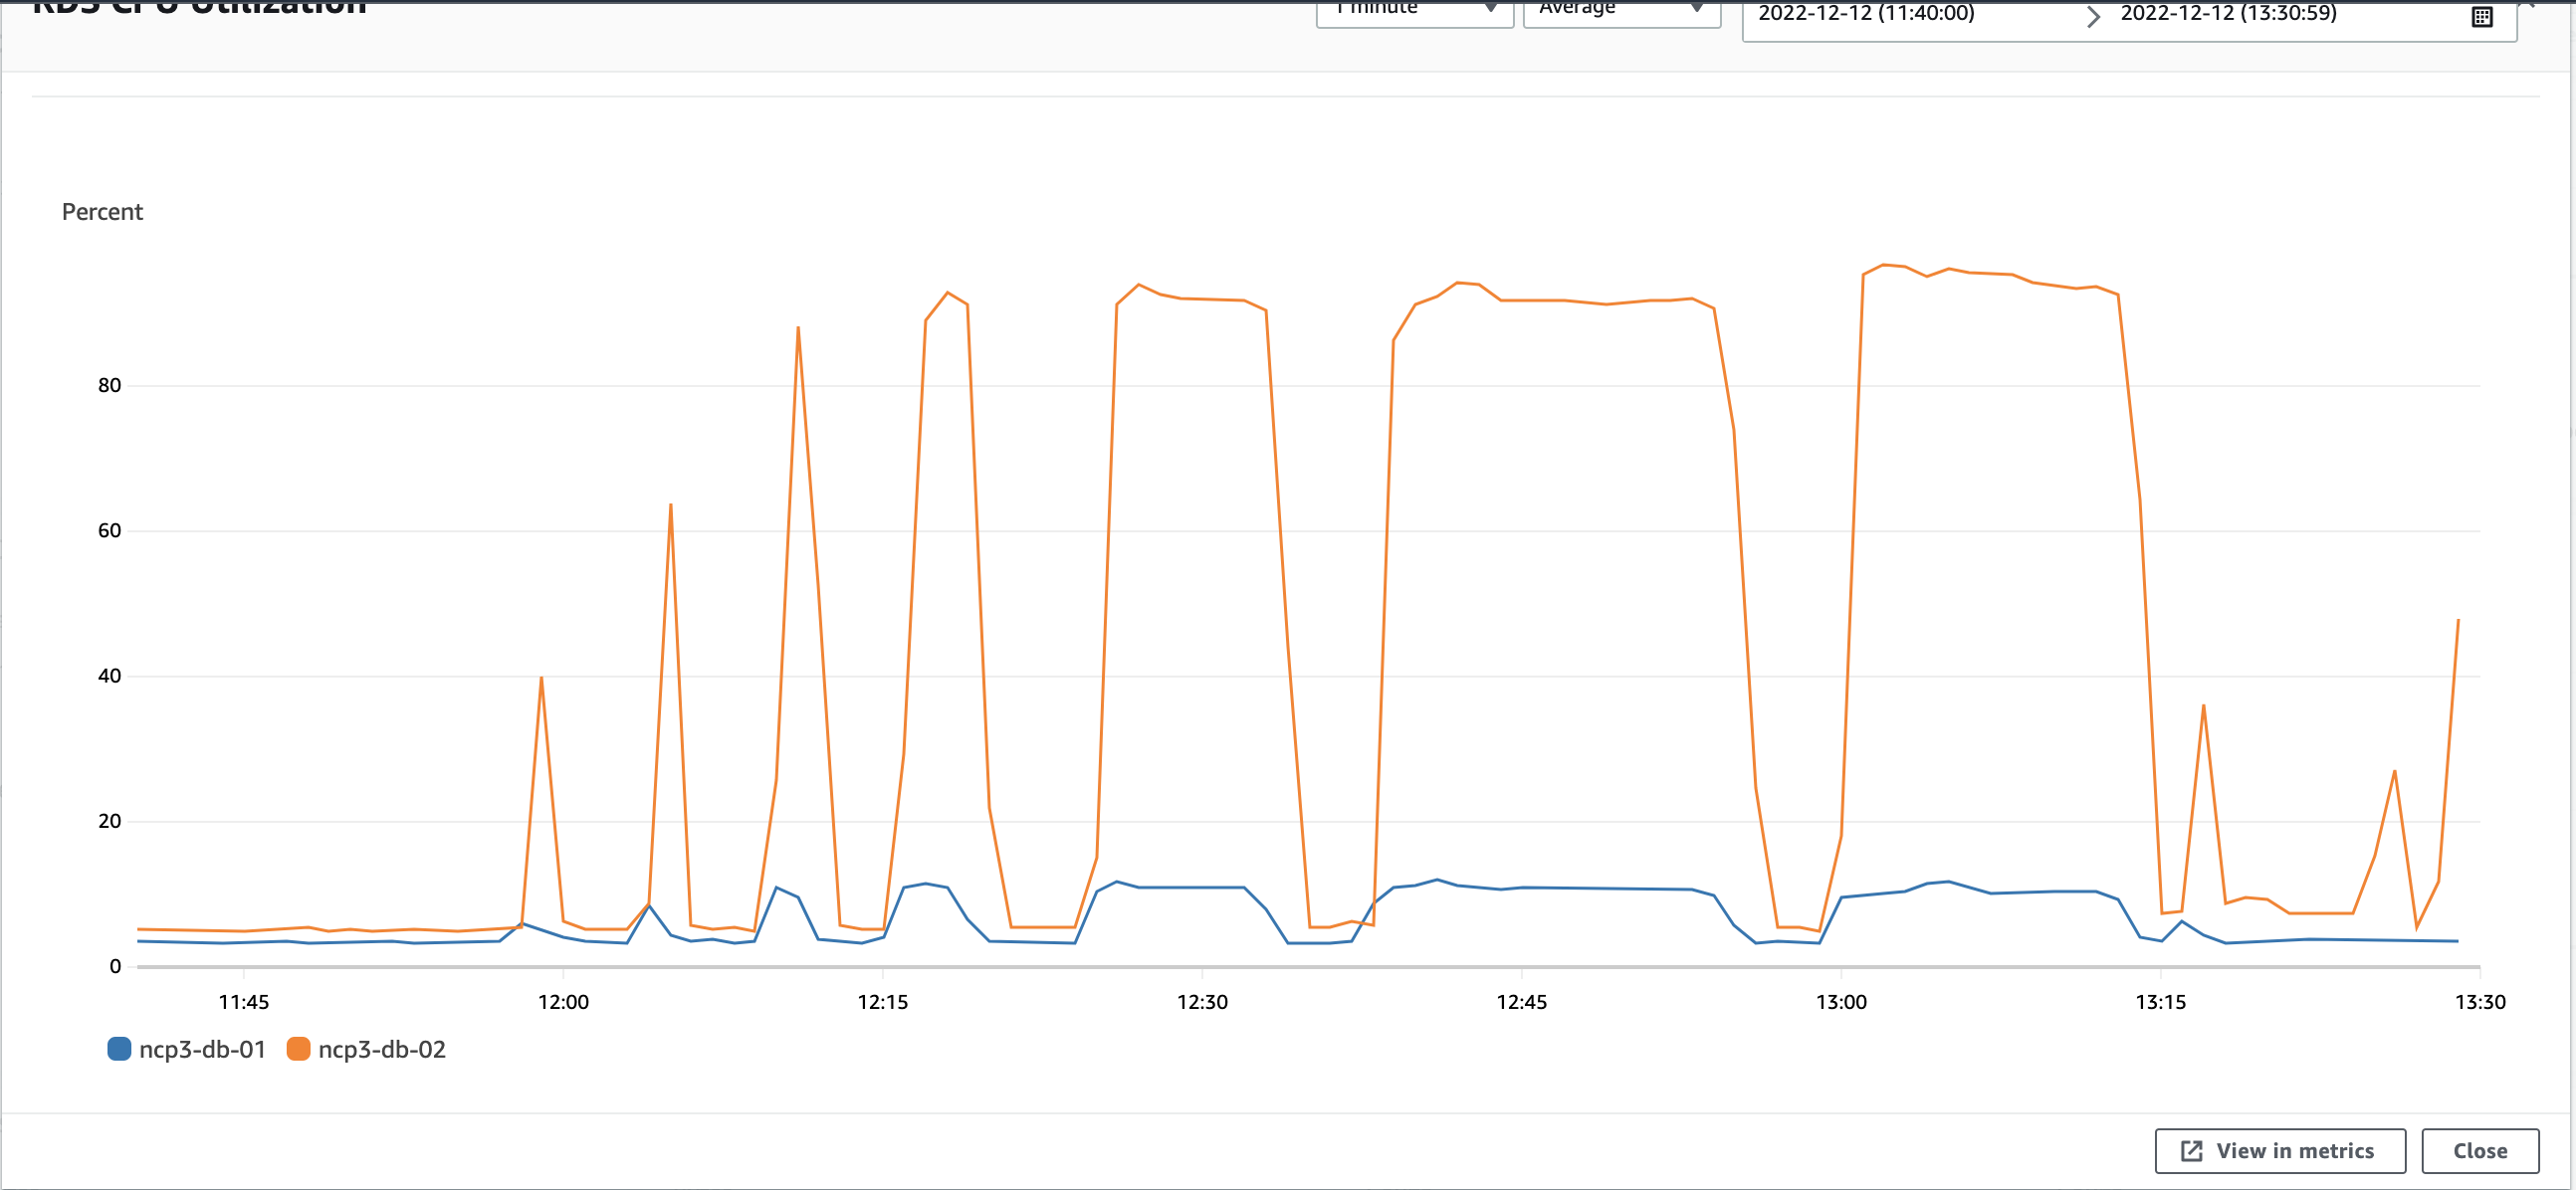
Note: During "create" imports with R/W split - we can see that there was 15% load on reader DB node.
Note: Each spike on this chart corresponding to each DI test performed.
100K create
Resources usage "updates"
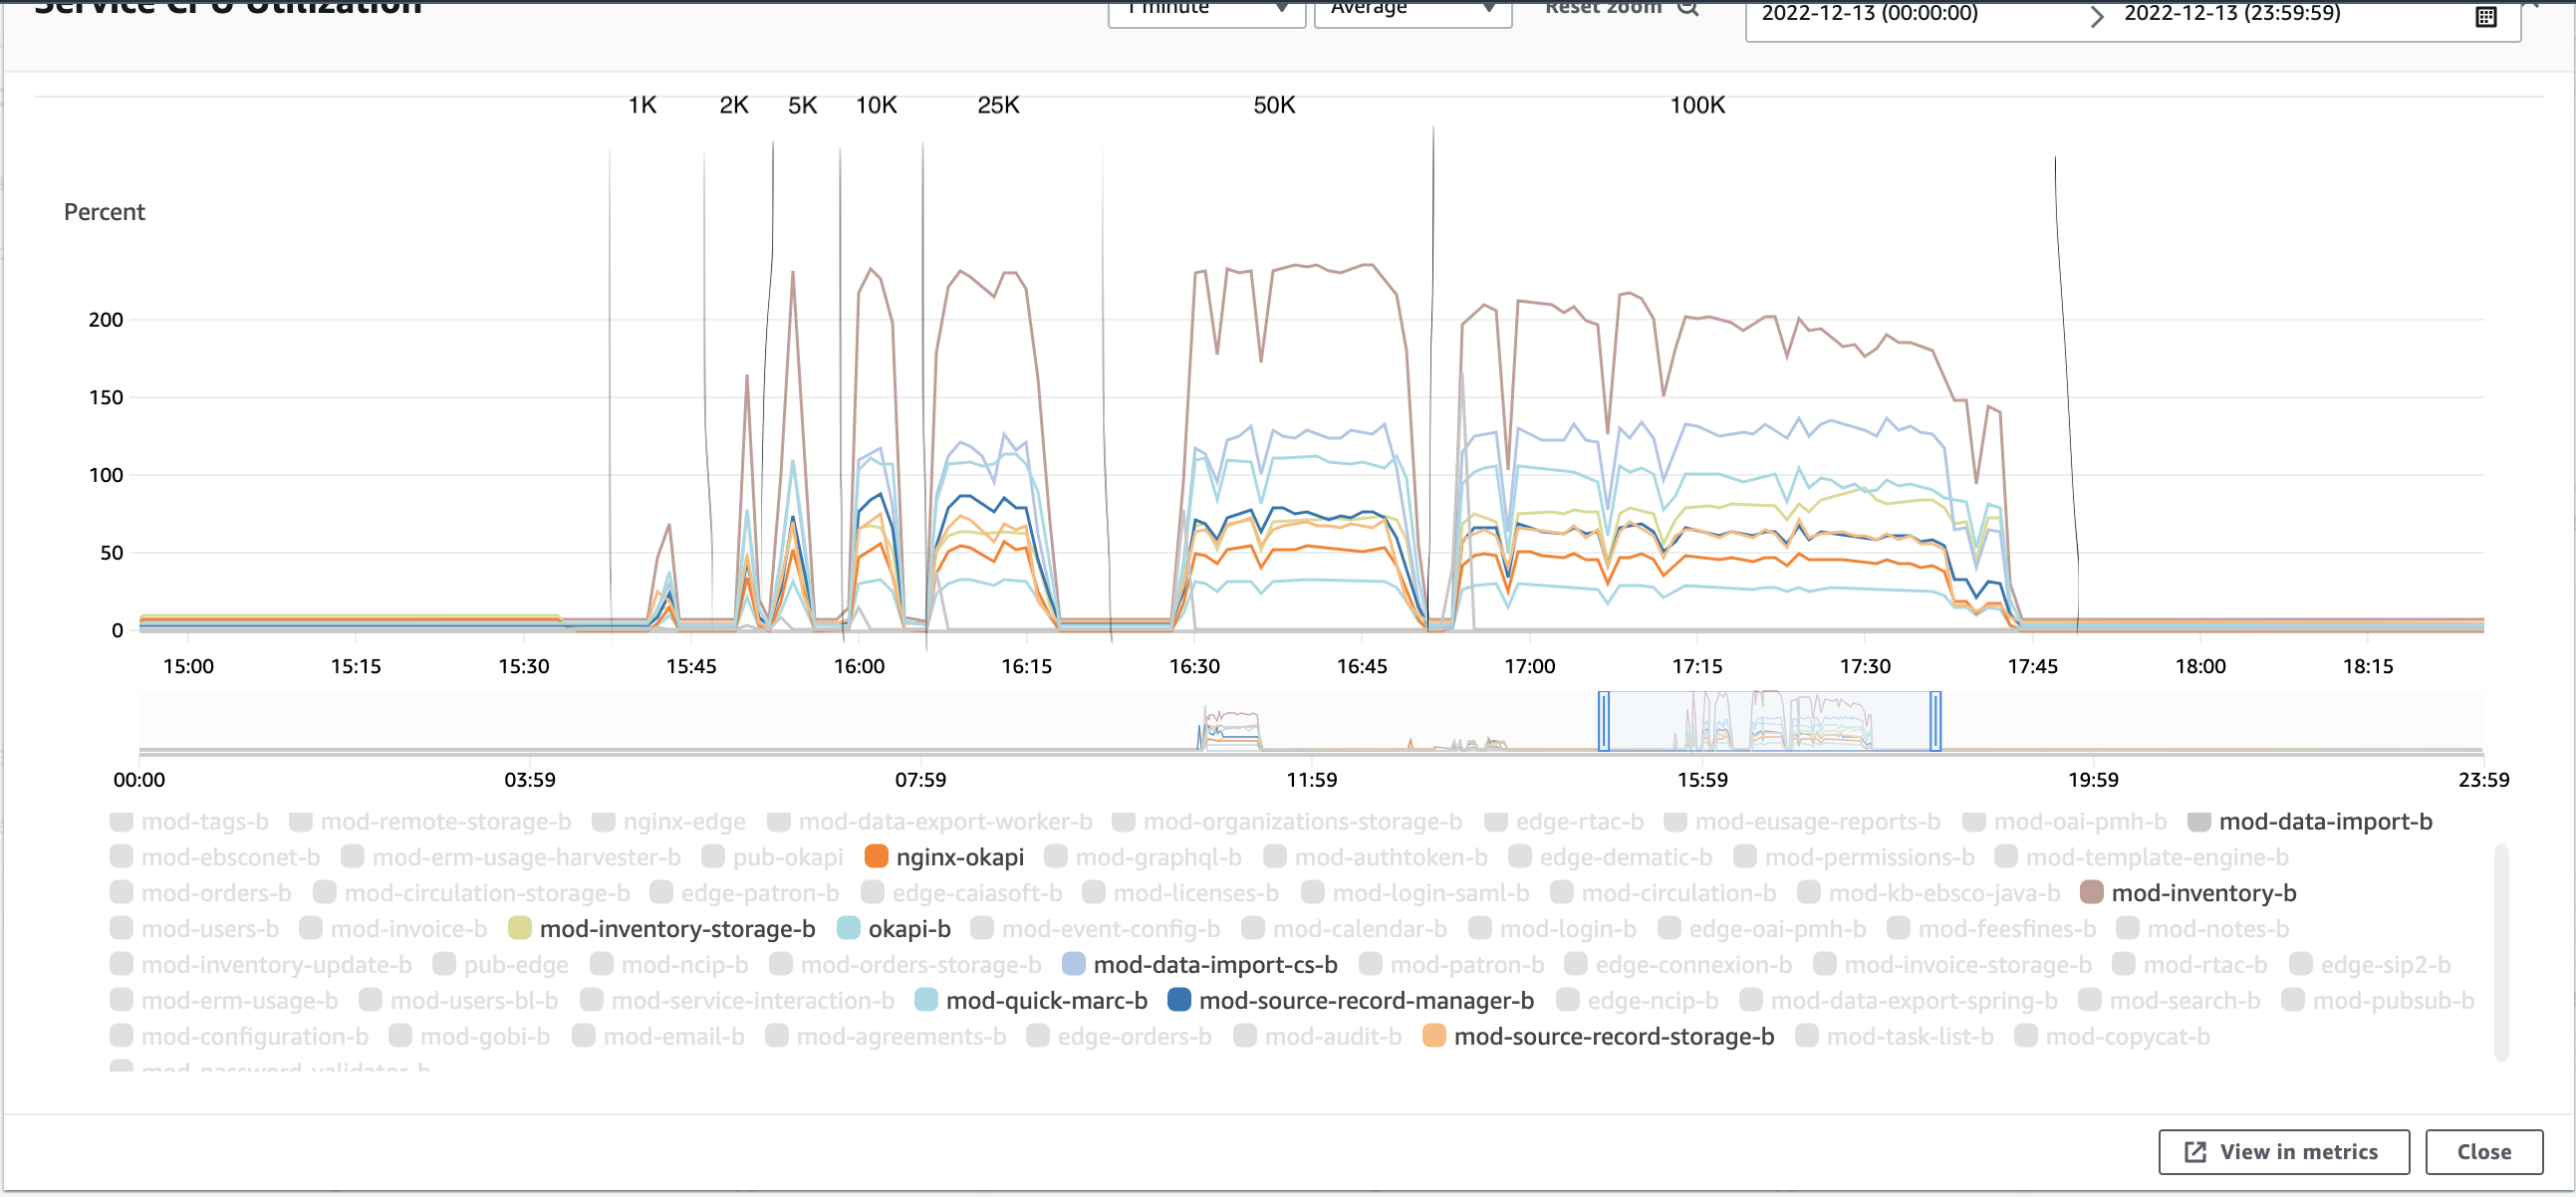
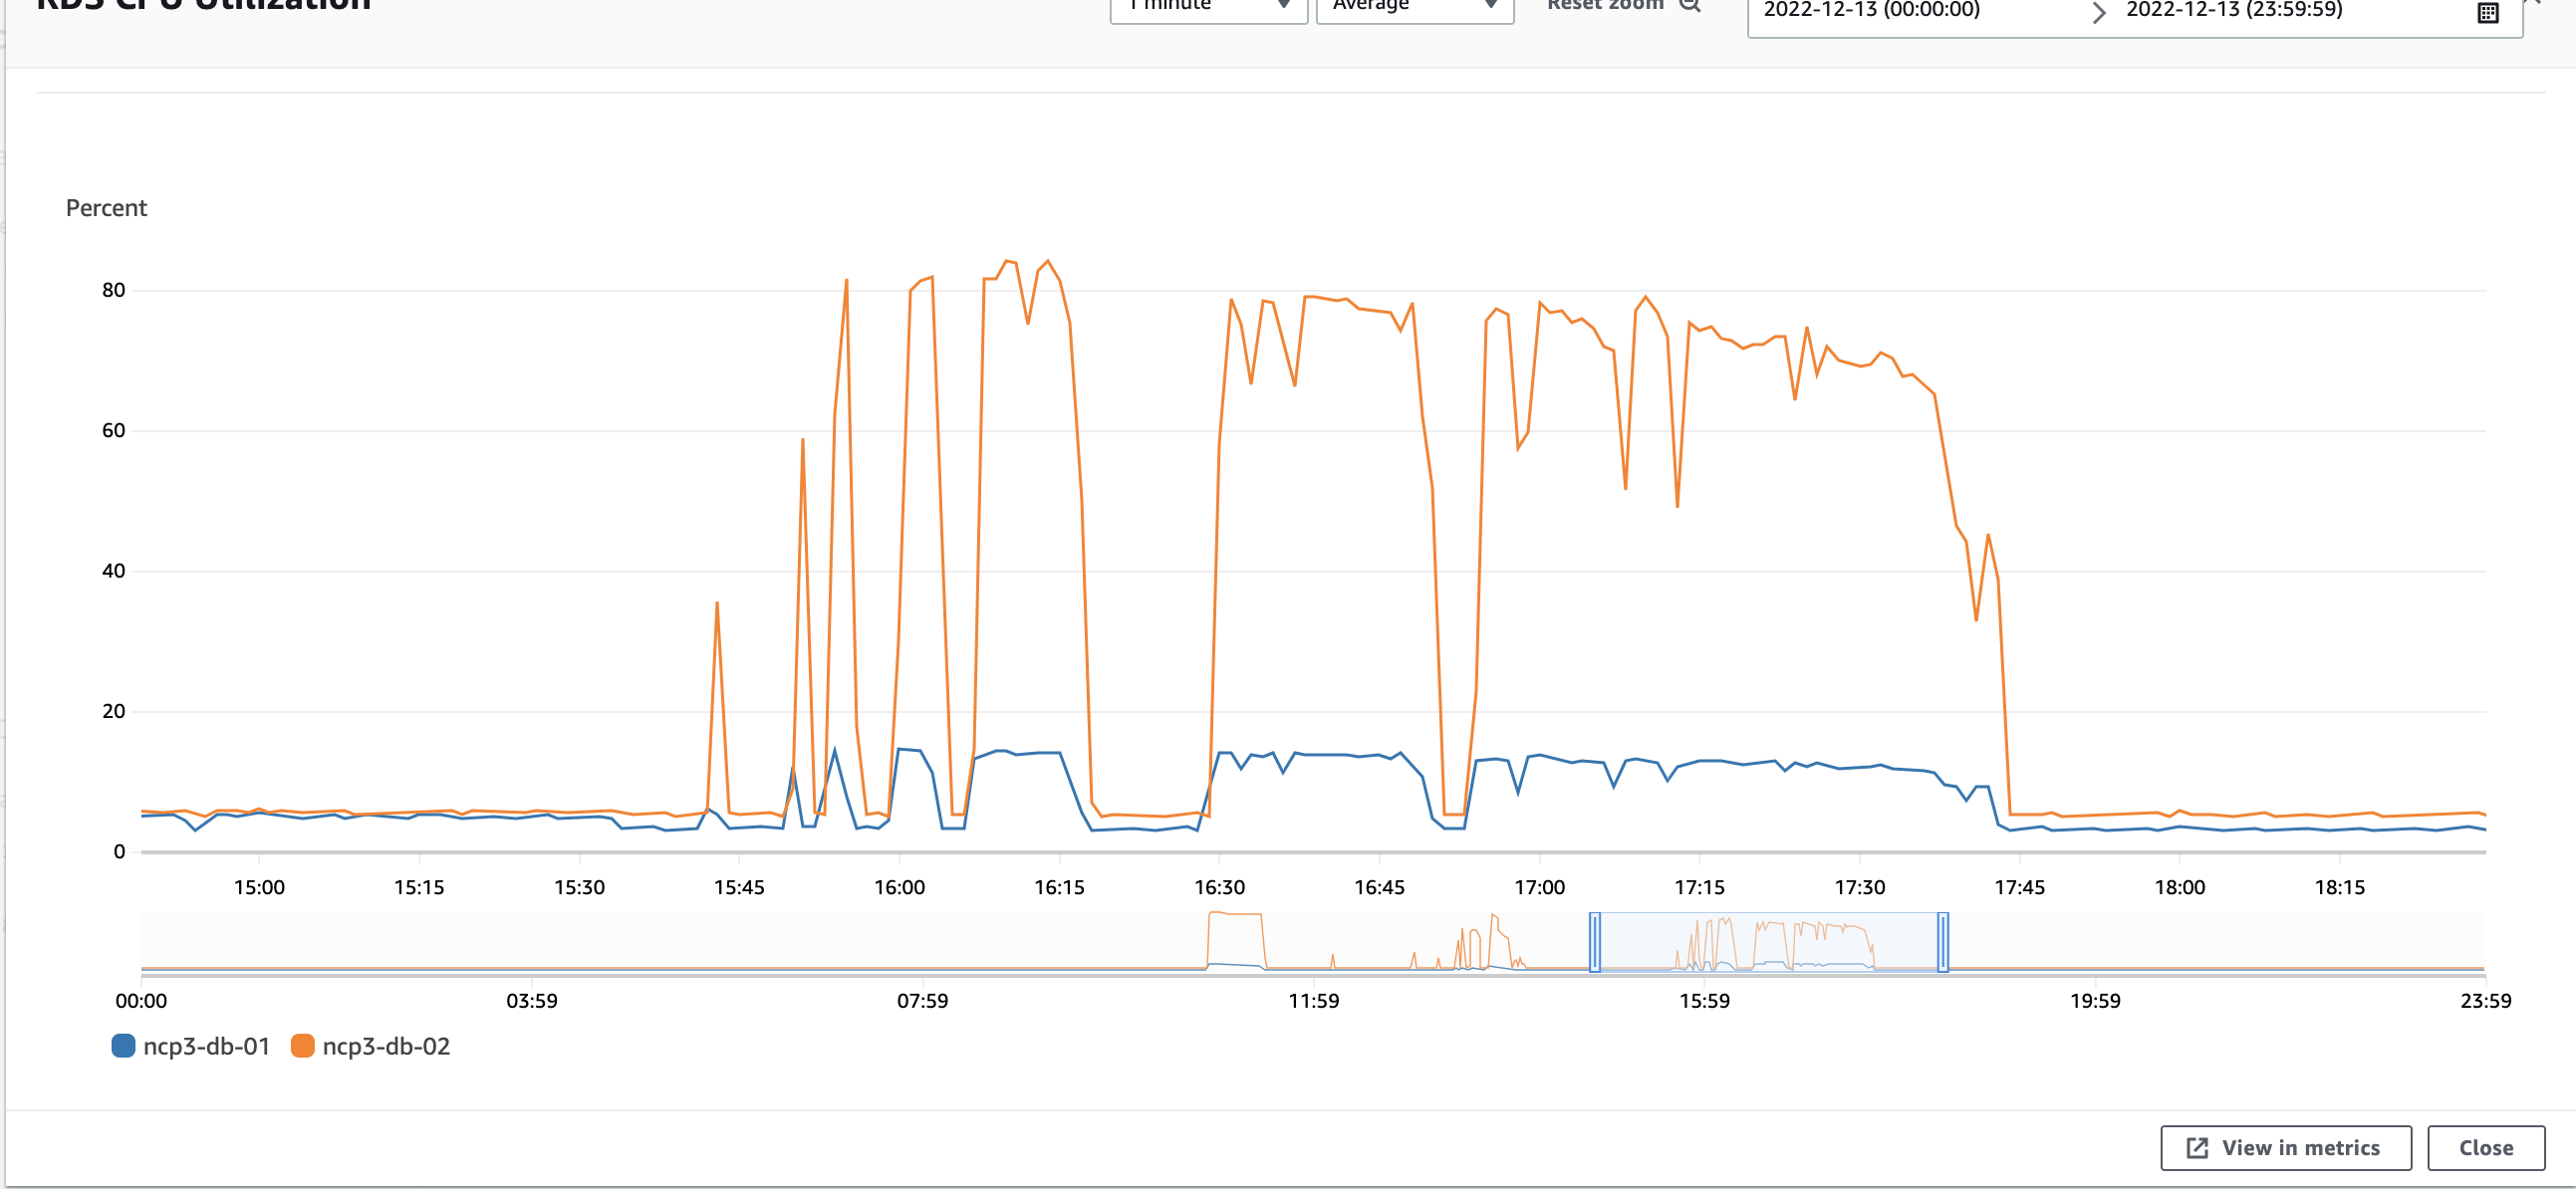
Note: With R/W split for data import updates - reader node took on 15-17% of DB load.
Note: Each spike on this chart corresponding to each DI test performed.