PostgreSQL JSONB is not for free
- Taras Spashchenko
- Tod Olson
I have done some tests during my performance analysis for SRS and I want to share results with you.
I used the database with more than 11000000 records in SRS tables which represented source MARC records. I run queries against marc_records table.
I gathered servers statistics using nmon and nmon analysis tools for *nix servers.
The structure of the table was
Id: uuid - primary key
Content: jsonb - the field stores json representation of MARC records
InstanceId: uuid - A added this field and filled it in with values of 999th fields of MARC that store references to instances created.
Select count(1) cnt from marc_records returns 11142228
I run PostgreSQL Server in the Vagrant box on the bare metal host.
Host configuration:
CPU - Intel i7 8th gen with 12 vCores
RAM - 32 GB
Storage - 512 Gb SSD
Resources dedicated to Vagrant Box:
vCPU - 8
RAM - 24 GB
Storage - 256GB
PostgreSQL settings:
DB version - 10
shared_buffers = 16GB
work_mem = 64MB
max_worker_processes = 16
max_parallel_workers_per_gather = 2
max_parallel_workers = 8
effective_cache_size = 22GB
1. For the first set of queries, I did not use any indexes
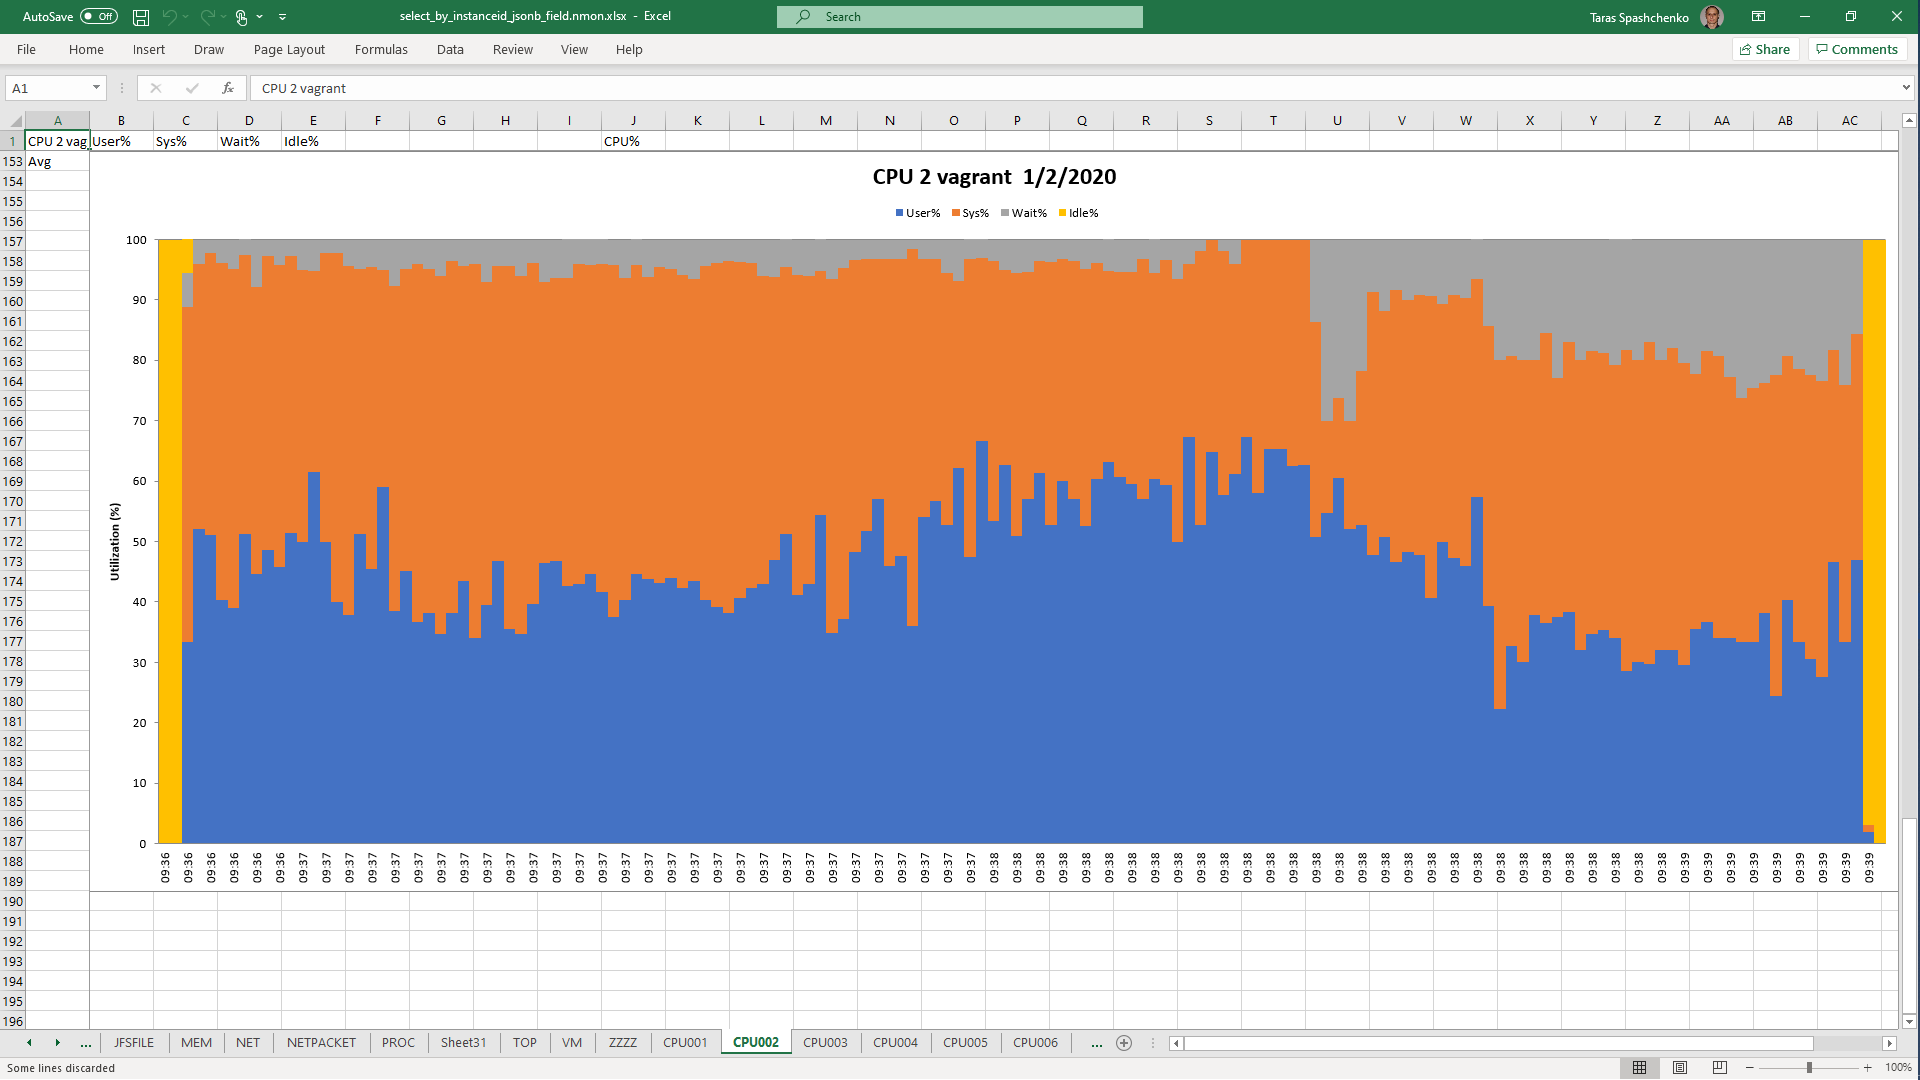
1.1 select * From diku_mod_source_record_storage.marc_records where content #>> '{fields, 33, 999, subfields, 0, i}' = '3dba7c3a-2bd1-4b47-b44c-25ff91fa6308'
1 row retrieved starting from 1 in 2 m 26 s 842 ms (execution: 2 m 26 s 801 ms, fetching: 41 ms)
Gather  (cost=1000.00..1327286.39 rows=64268 width=708) (actual time=76916.930..77187.734 rows=1 loops=1)
  Workers Planned: 2
  Workers Launched: 2
  ->  Parallel Seq Scan on marc_records  (cost=0.00..1319859.59 rows=26778 width=708) (actual time=65646.620..76909.406 rows=0 loops=3)
        Filter: ((content #>> '{fields,33,999,subfields,0,i}'::text[]) = '3dba7c3a-2bd1-4b47-b44c-25ff91fa6308'::text)
        Rows Removed by Filter: 3714076
Planning time: 0.038 ms
Execution time: 77187.764 ms
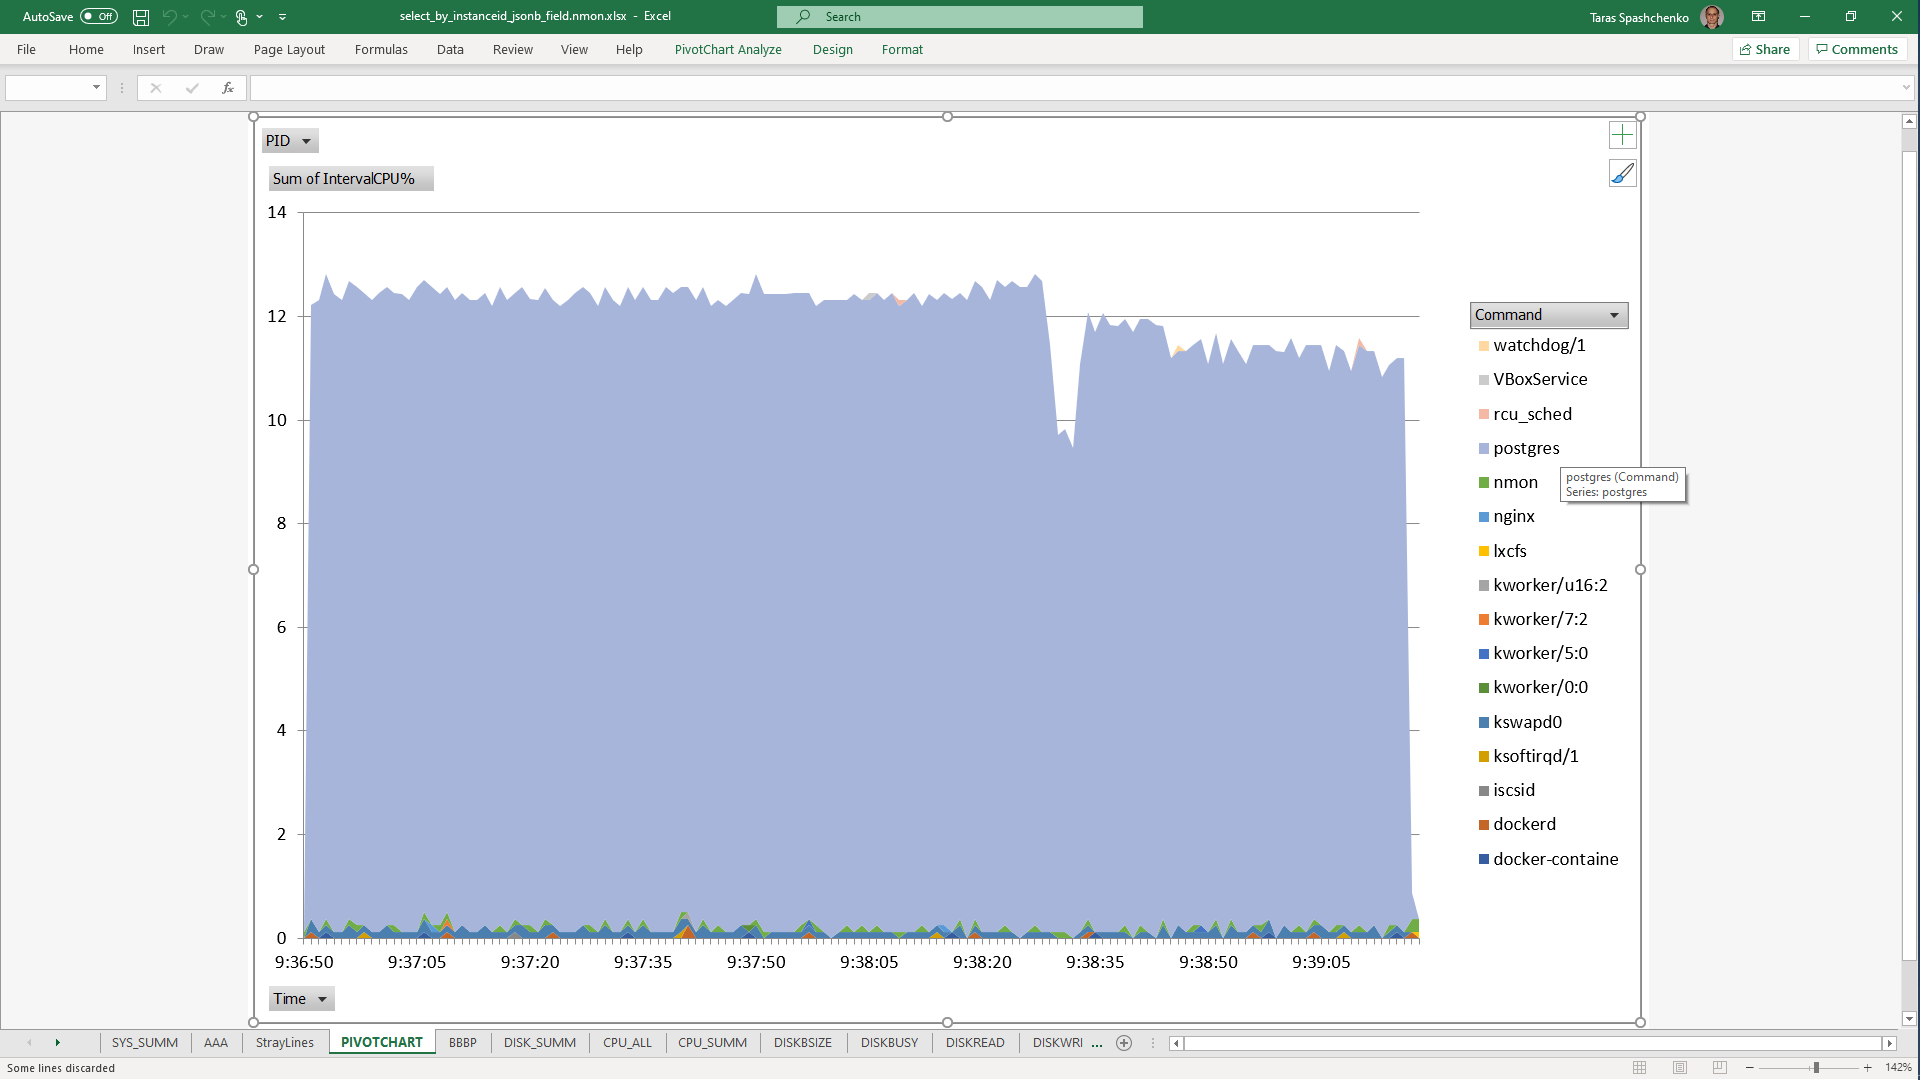
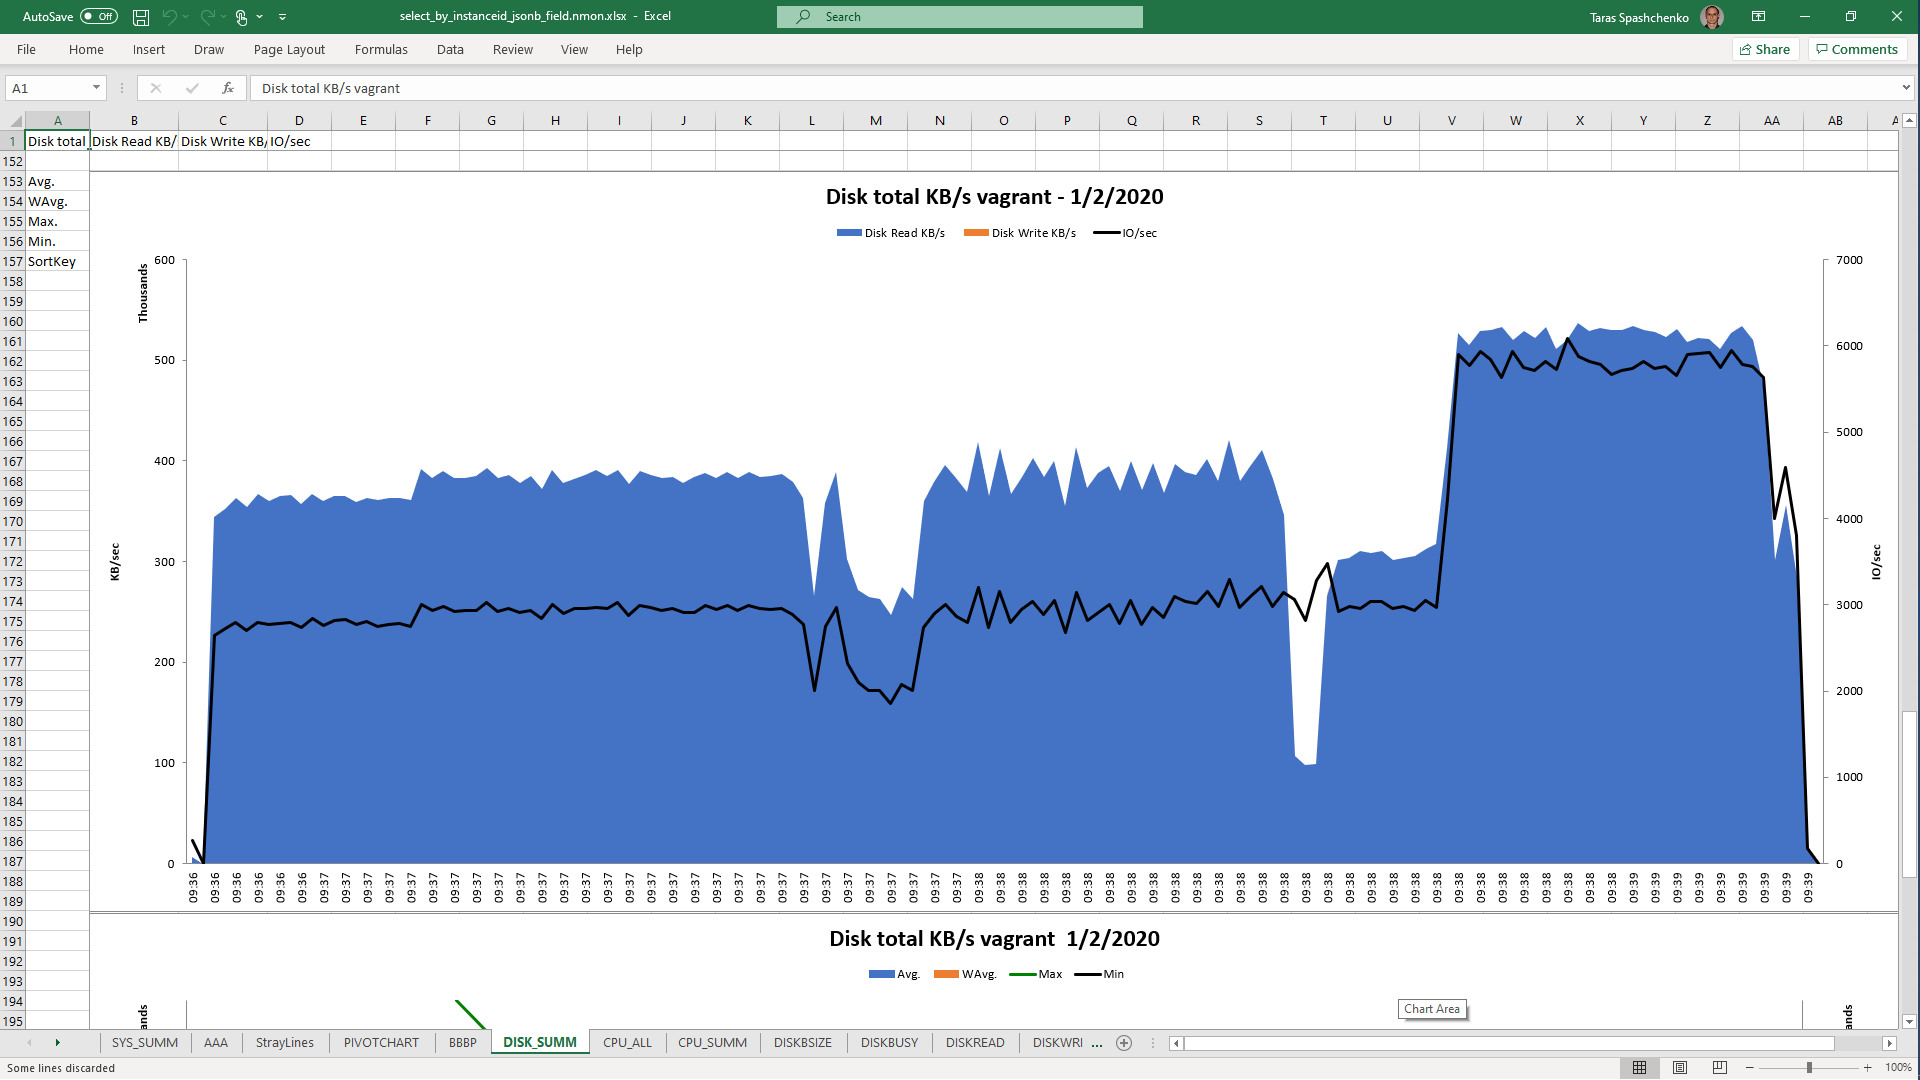
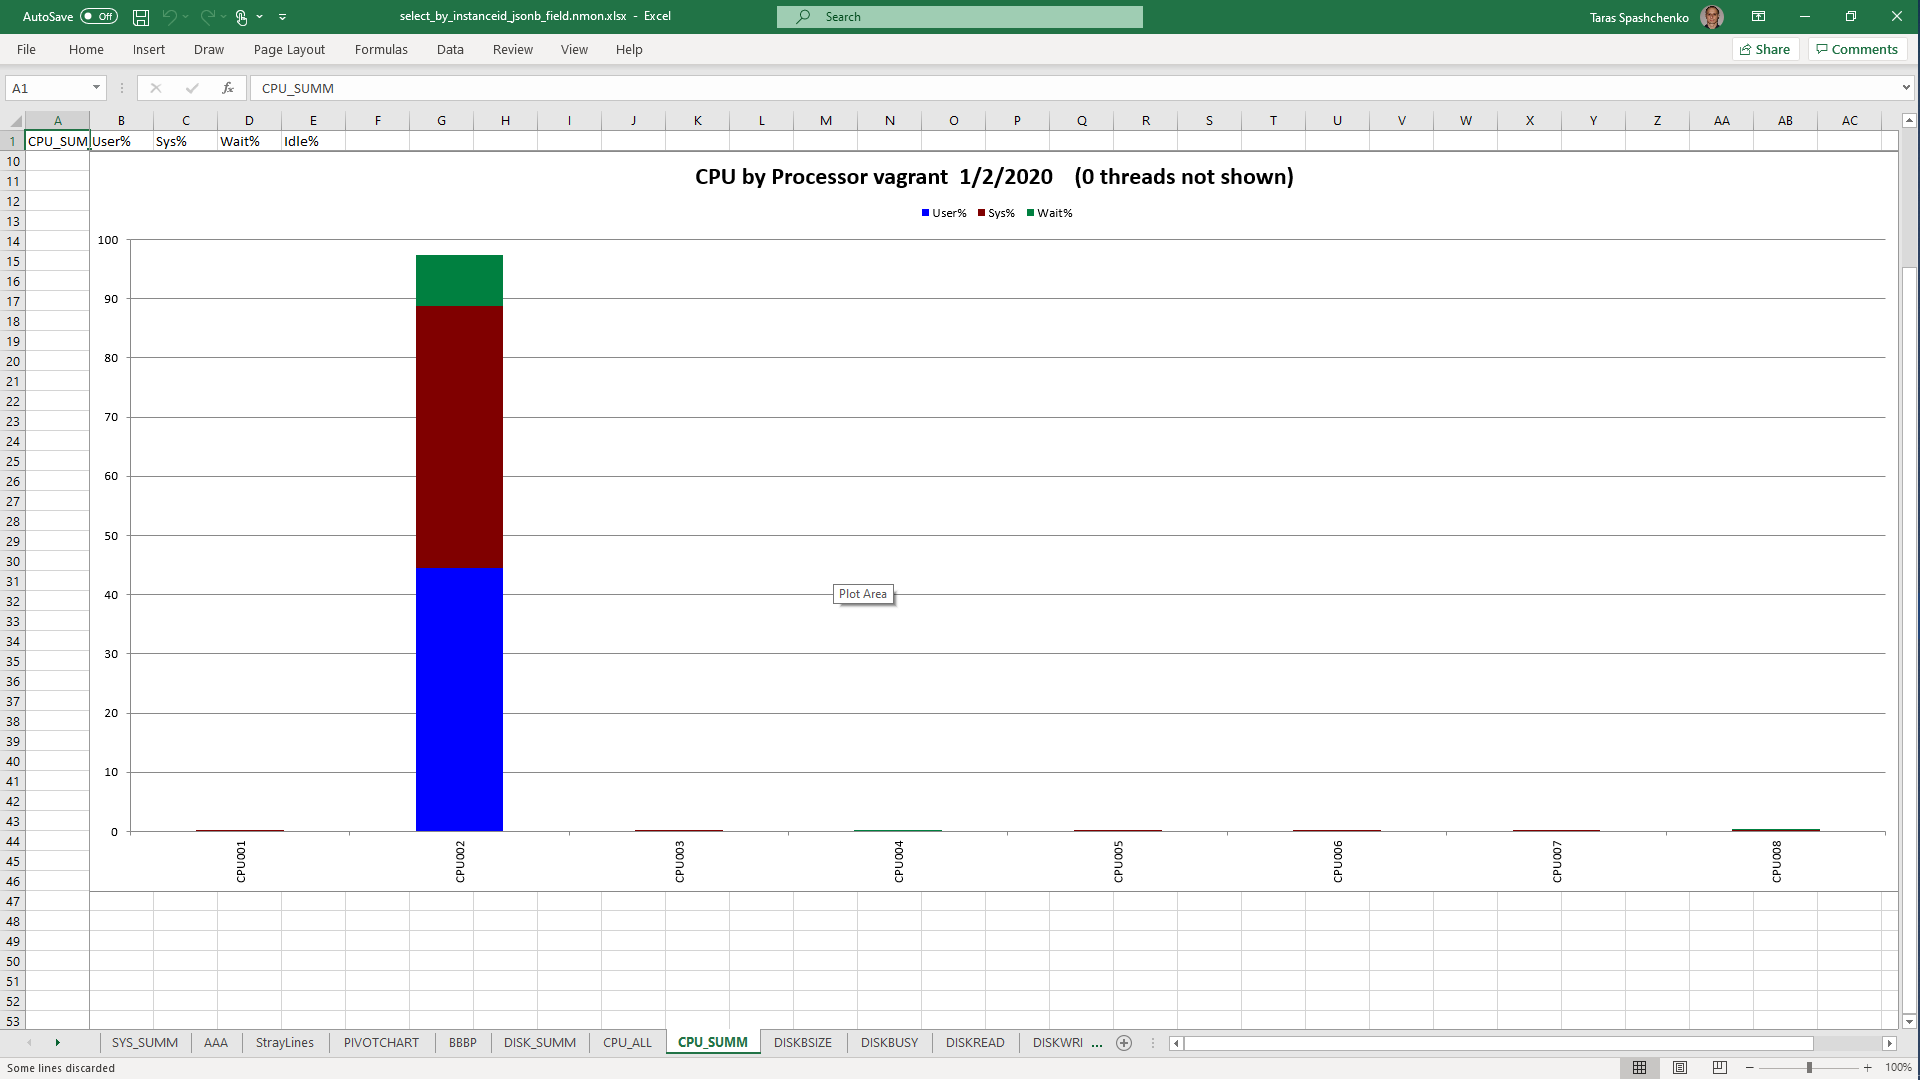
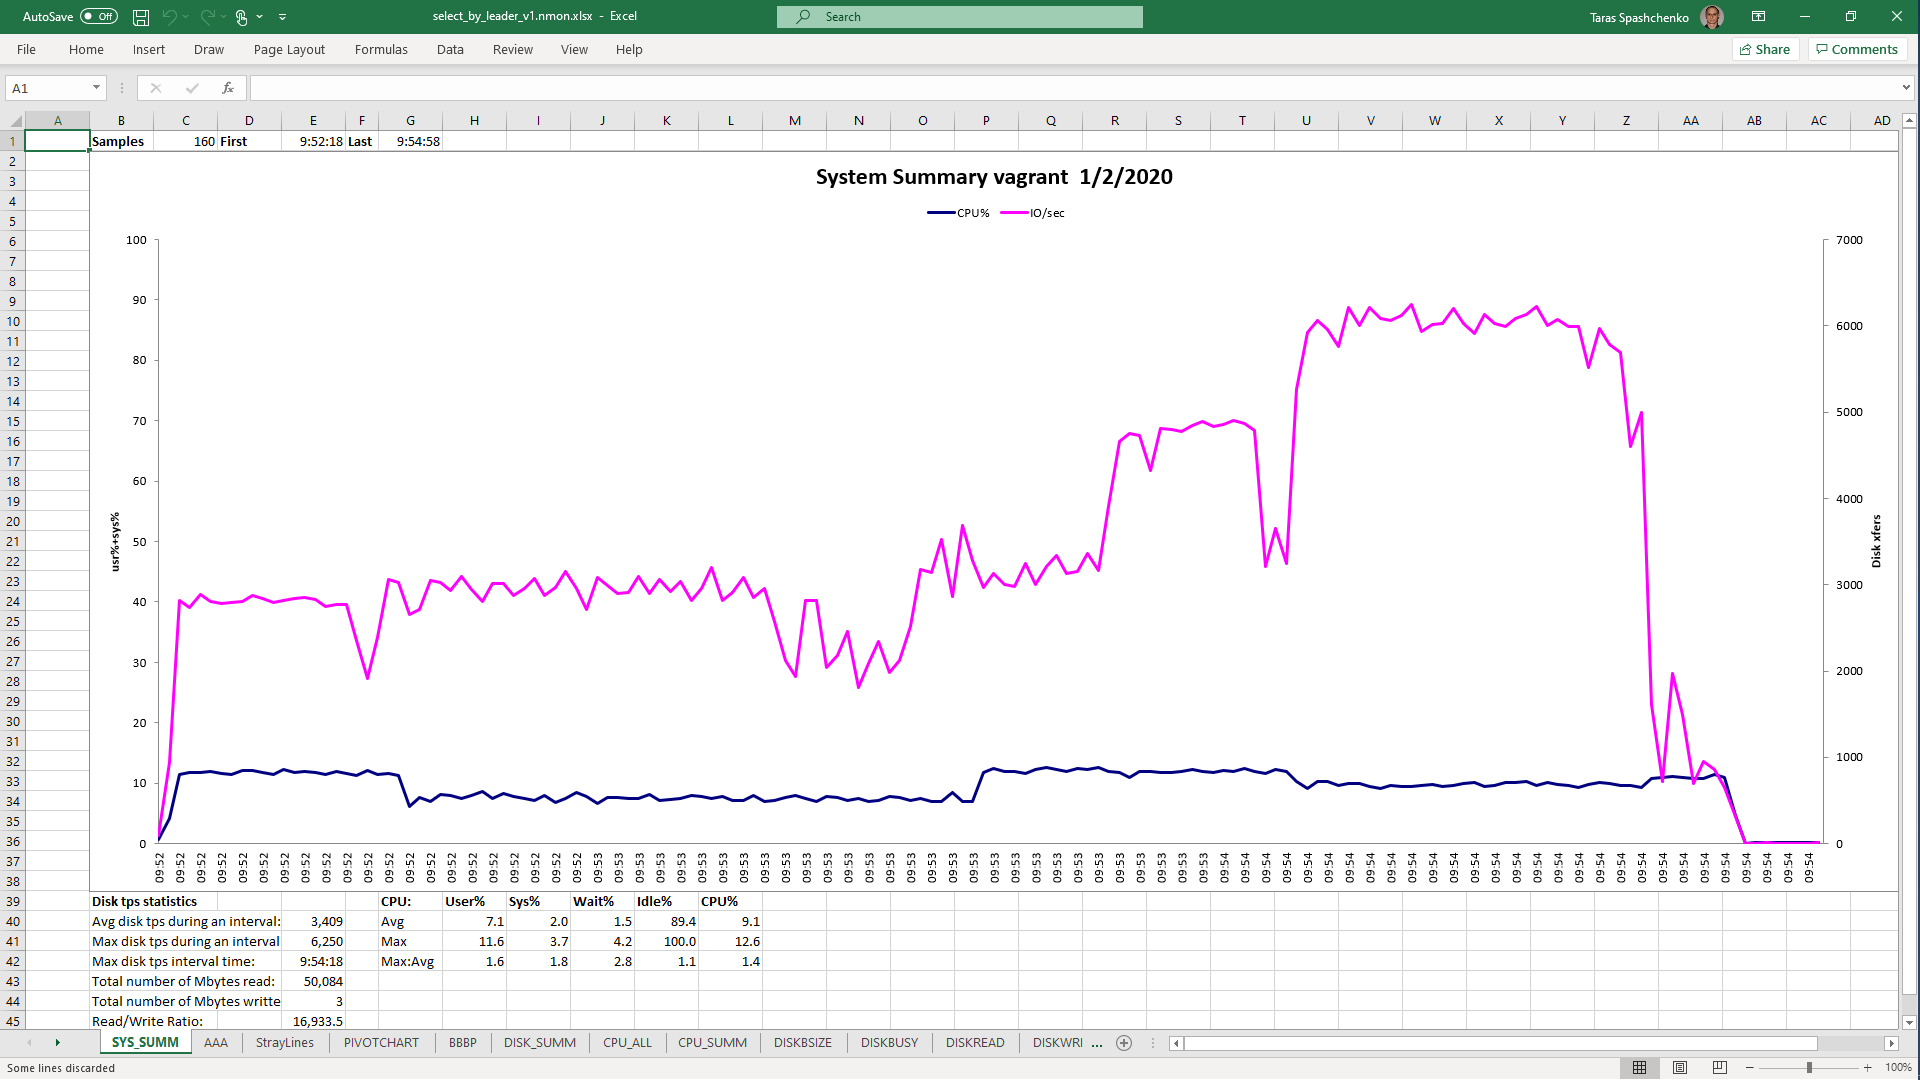
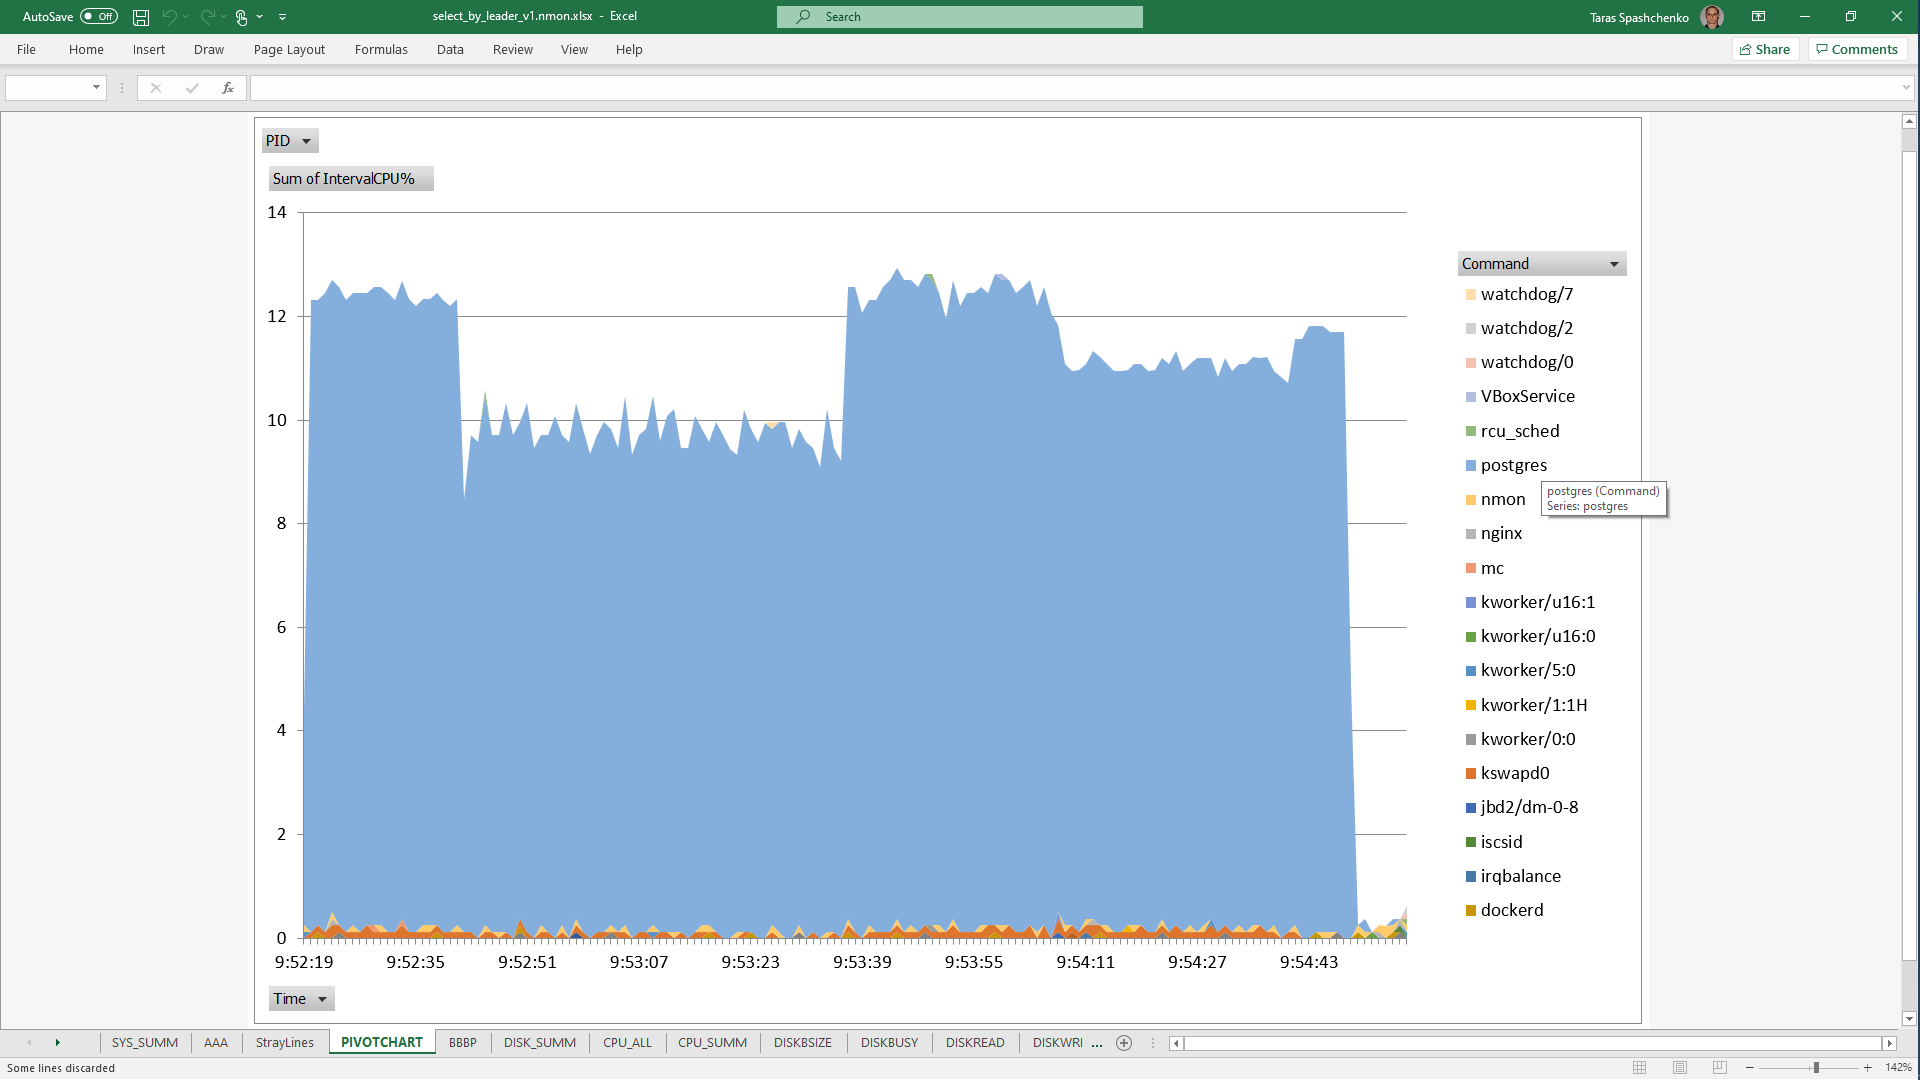
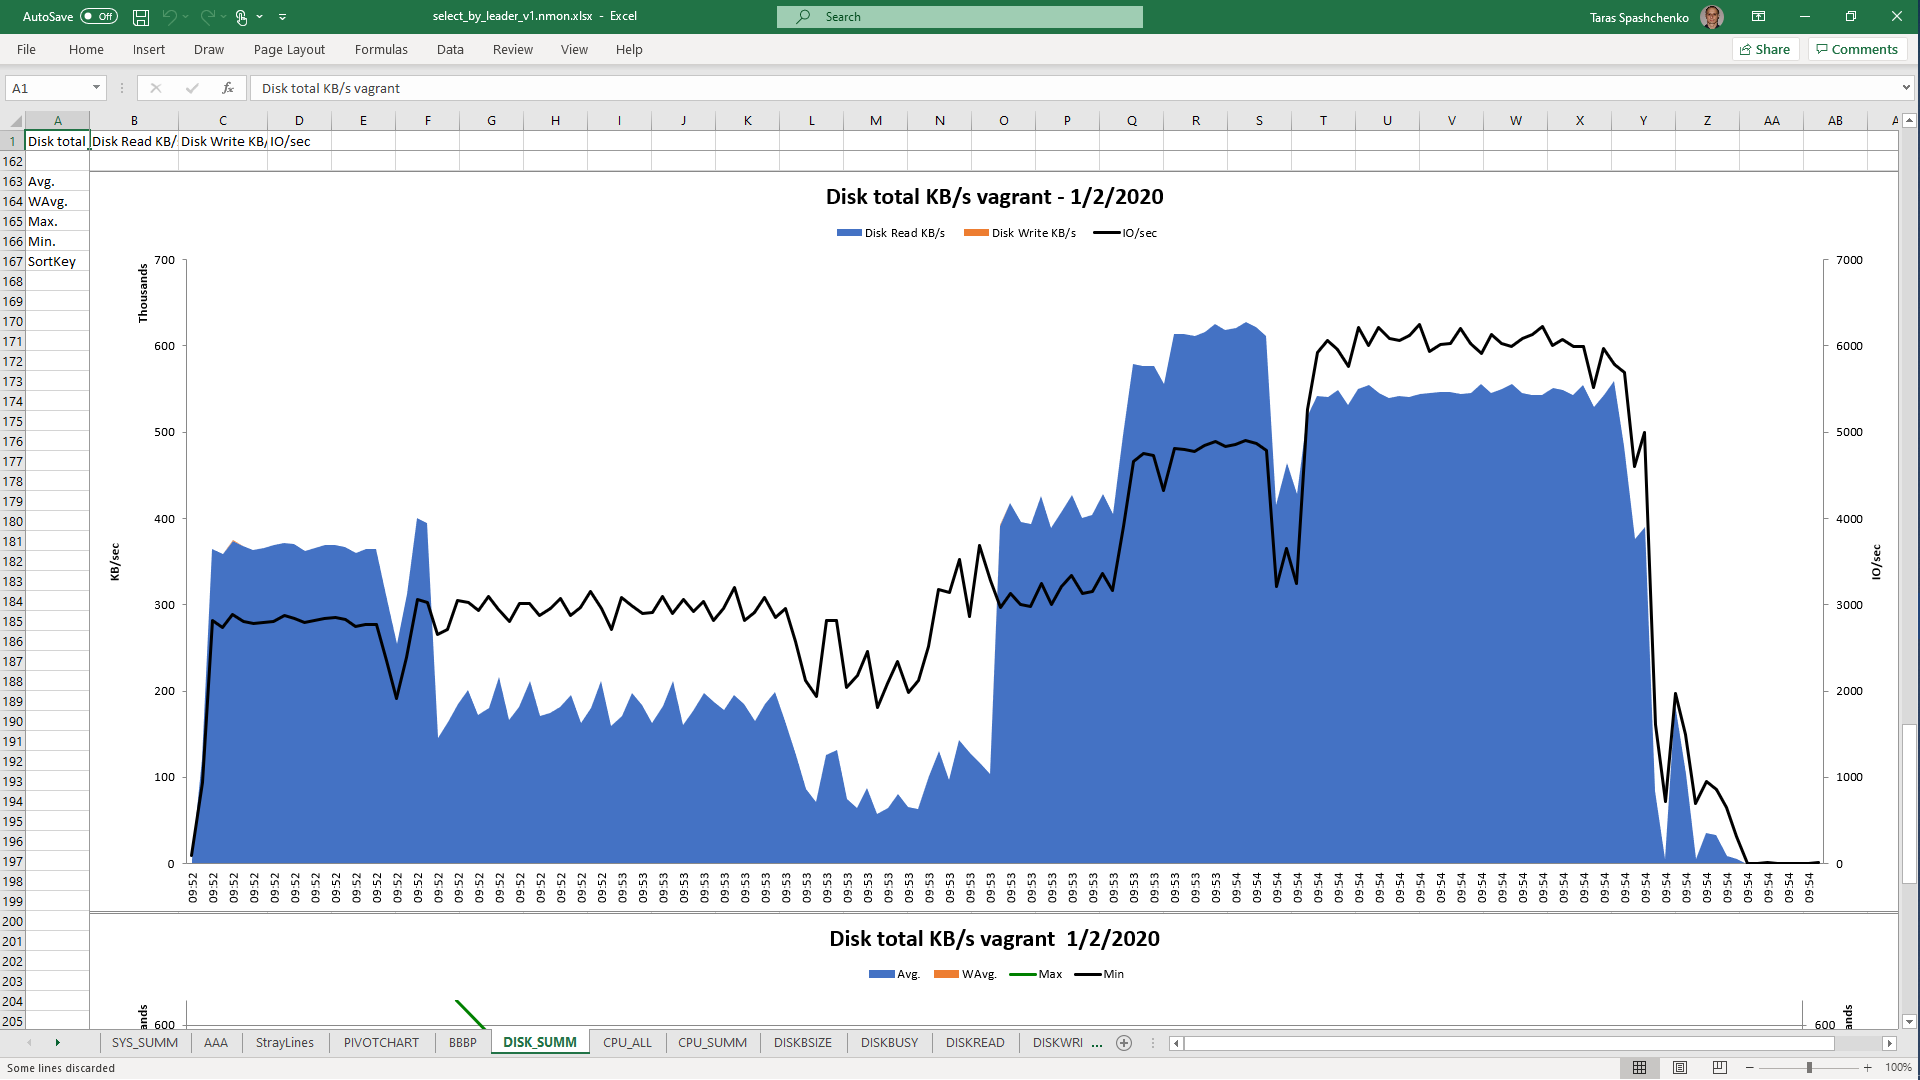
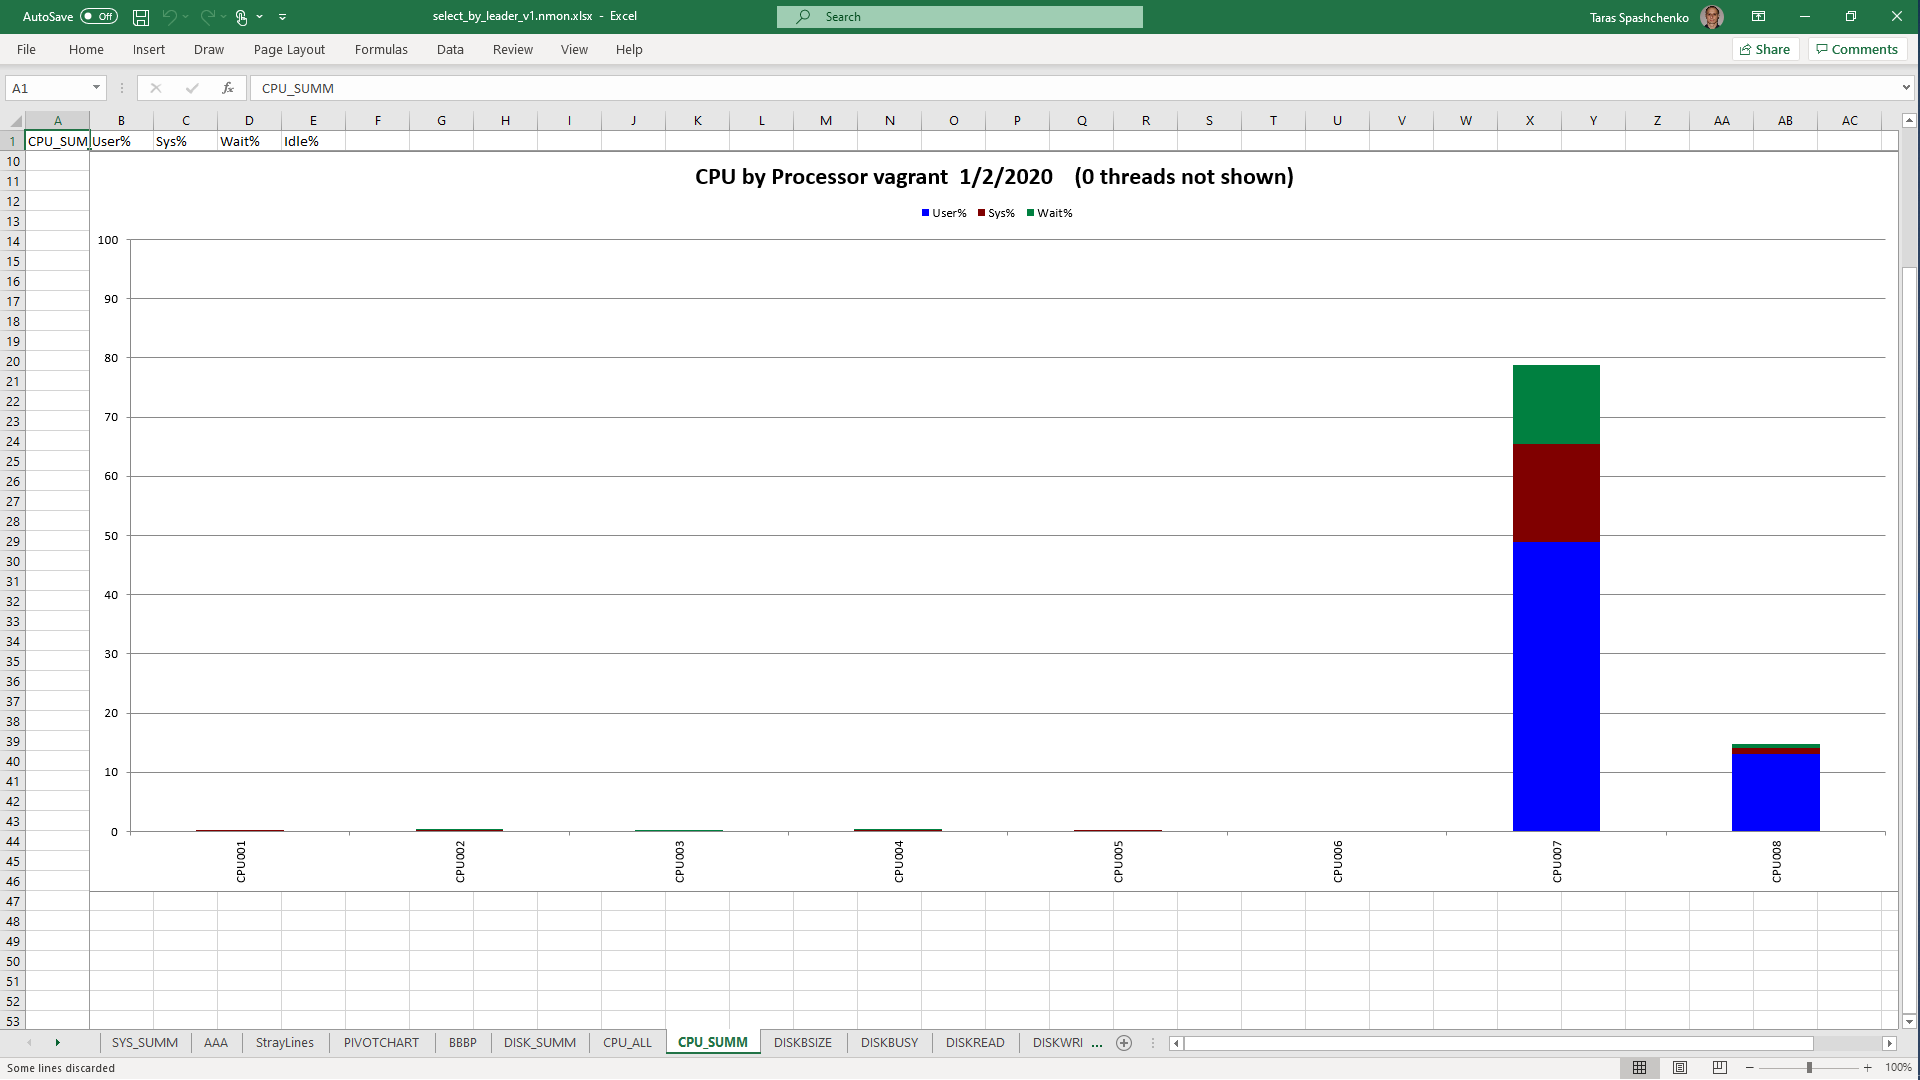
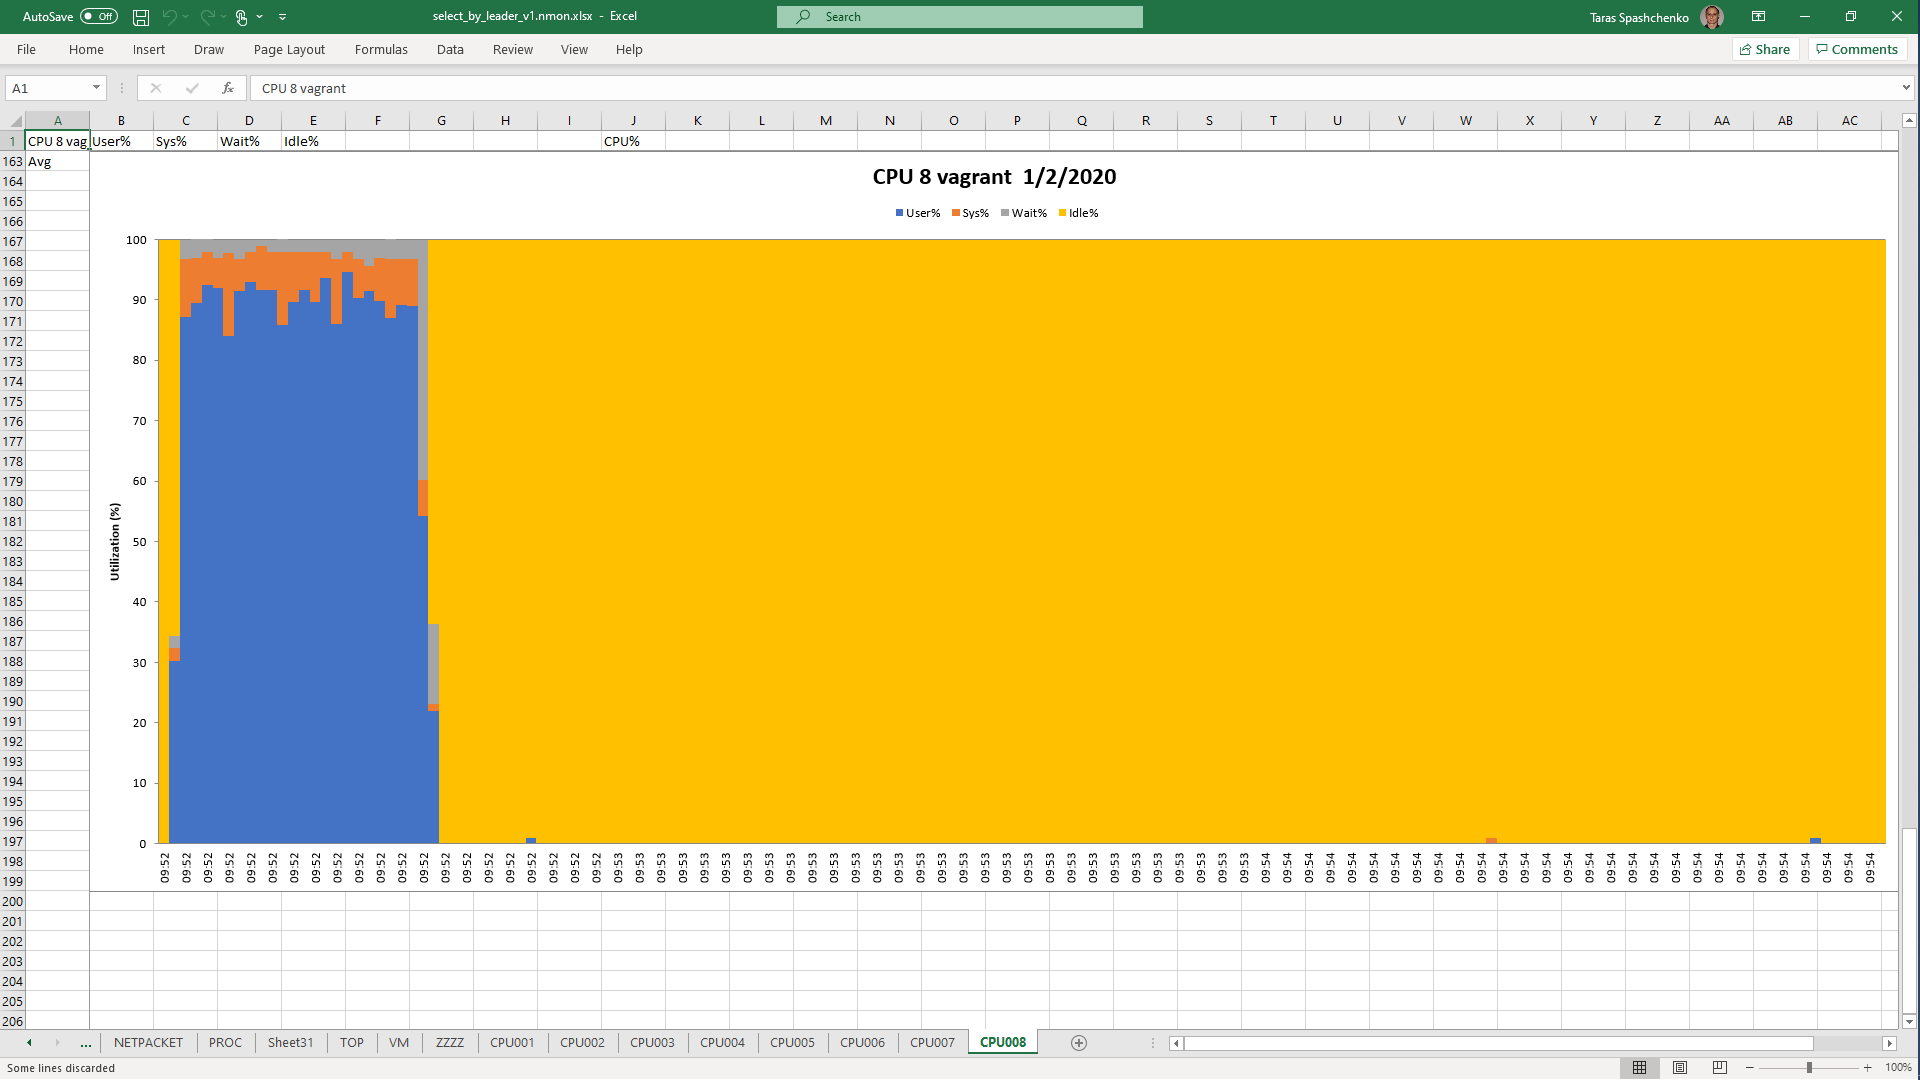
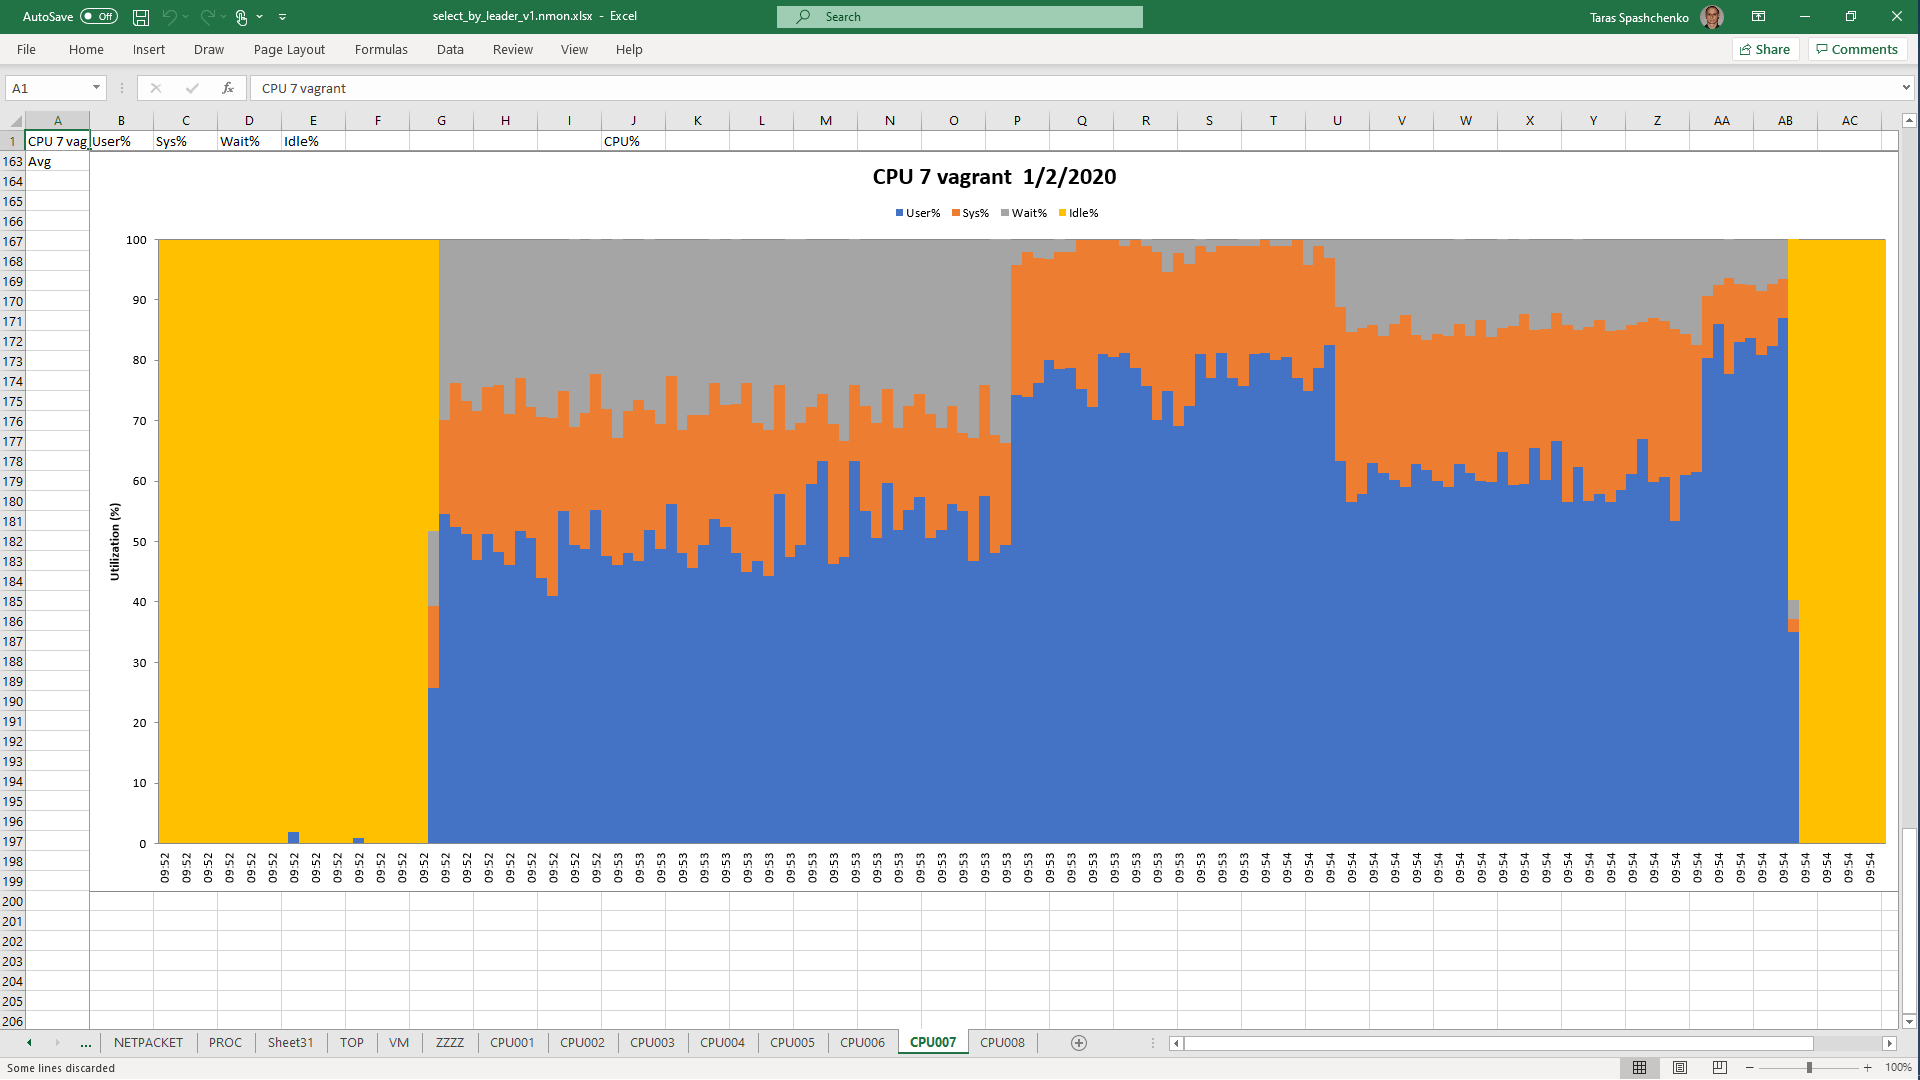
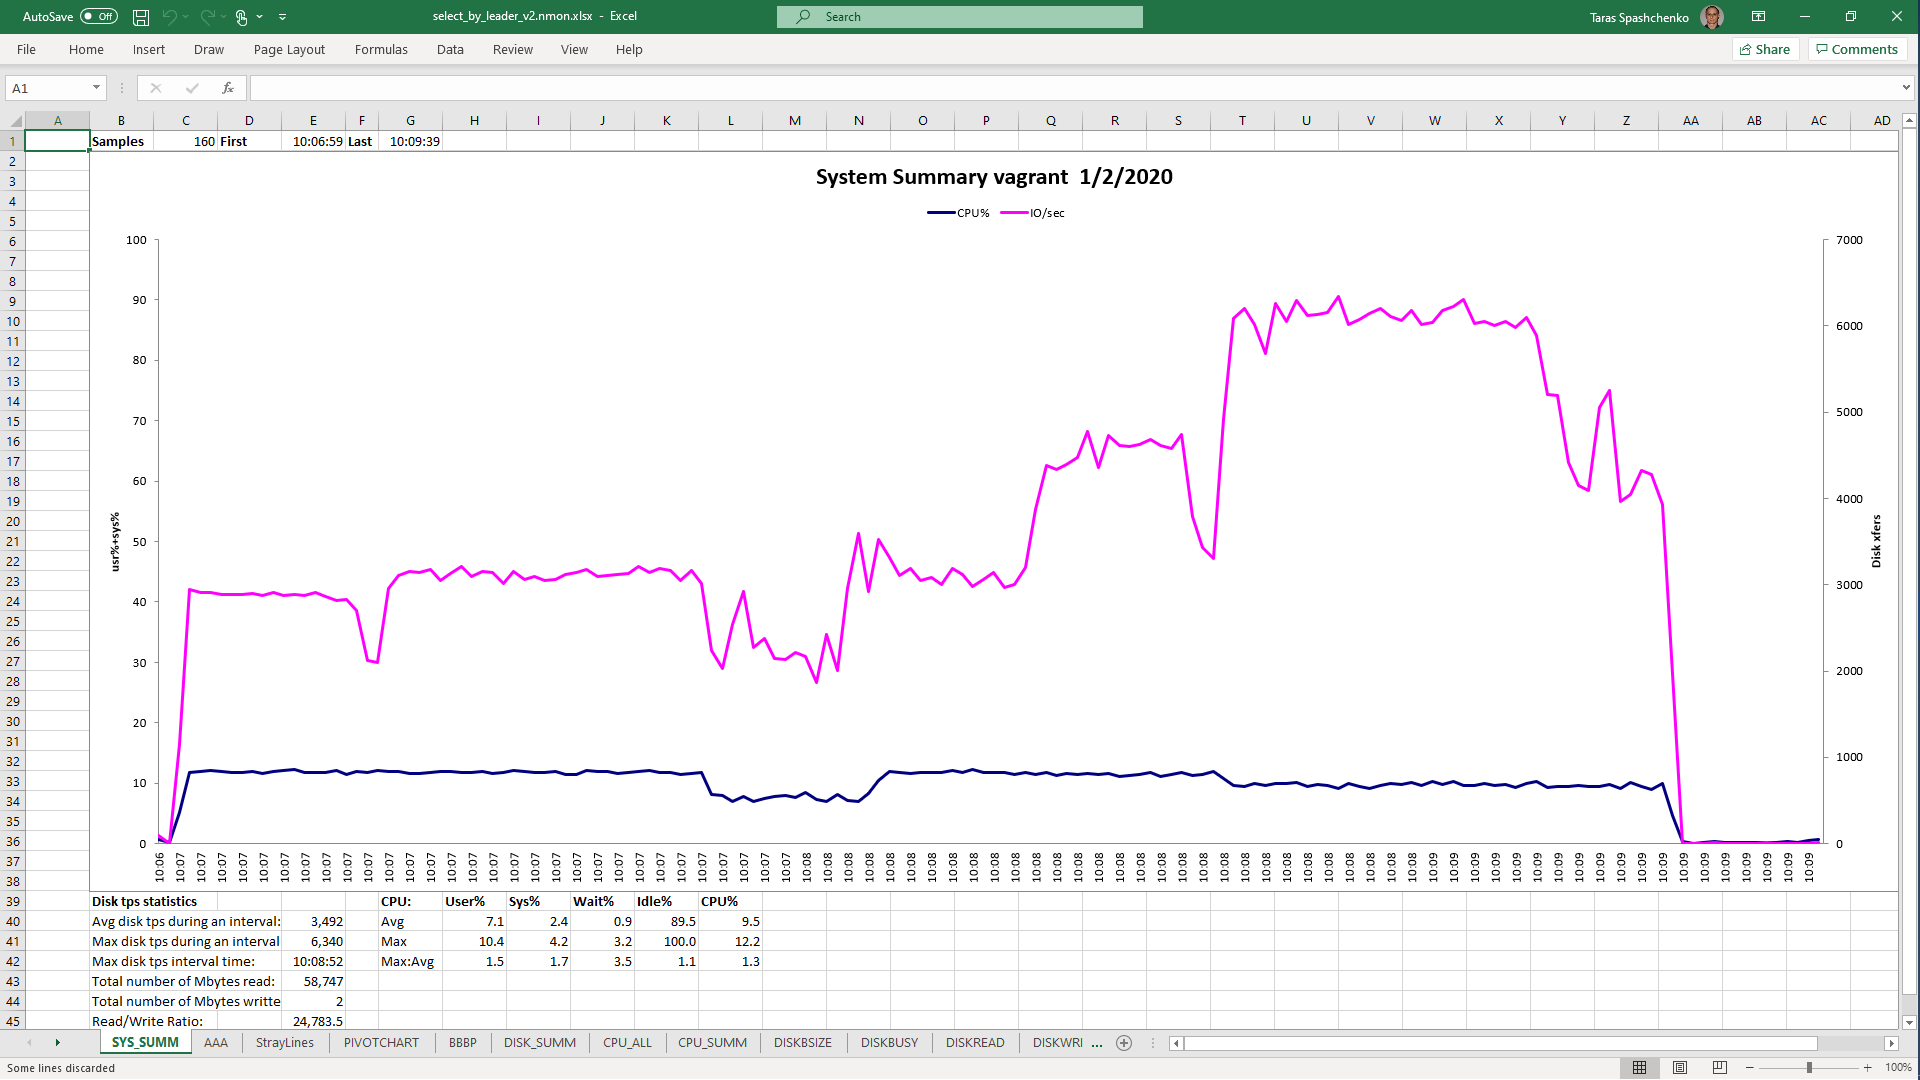
DB Server resources utilization statistics
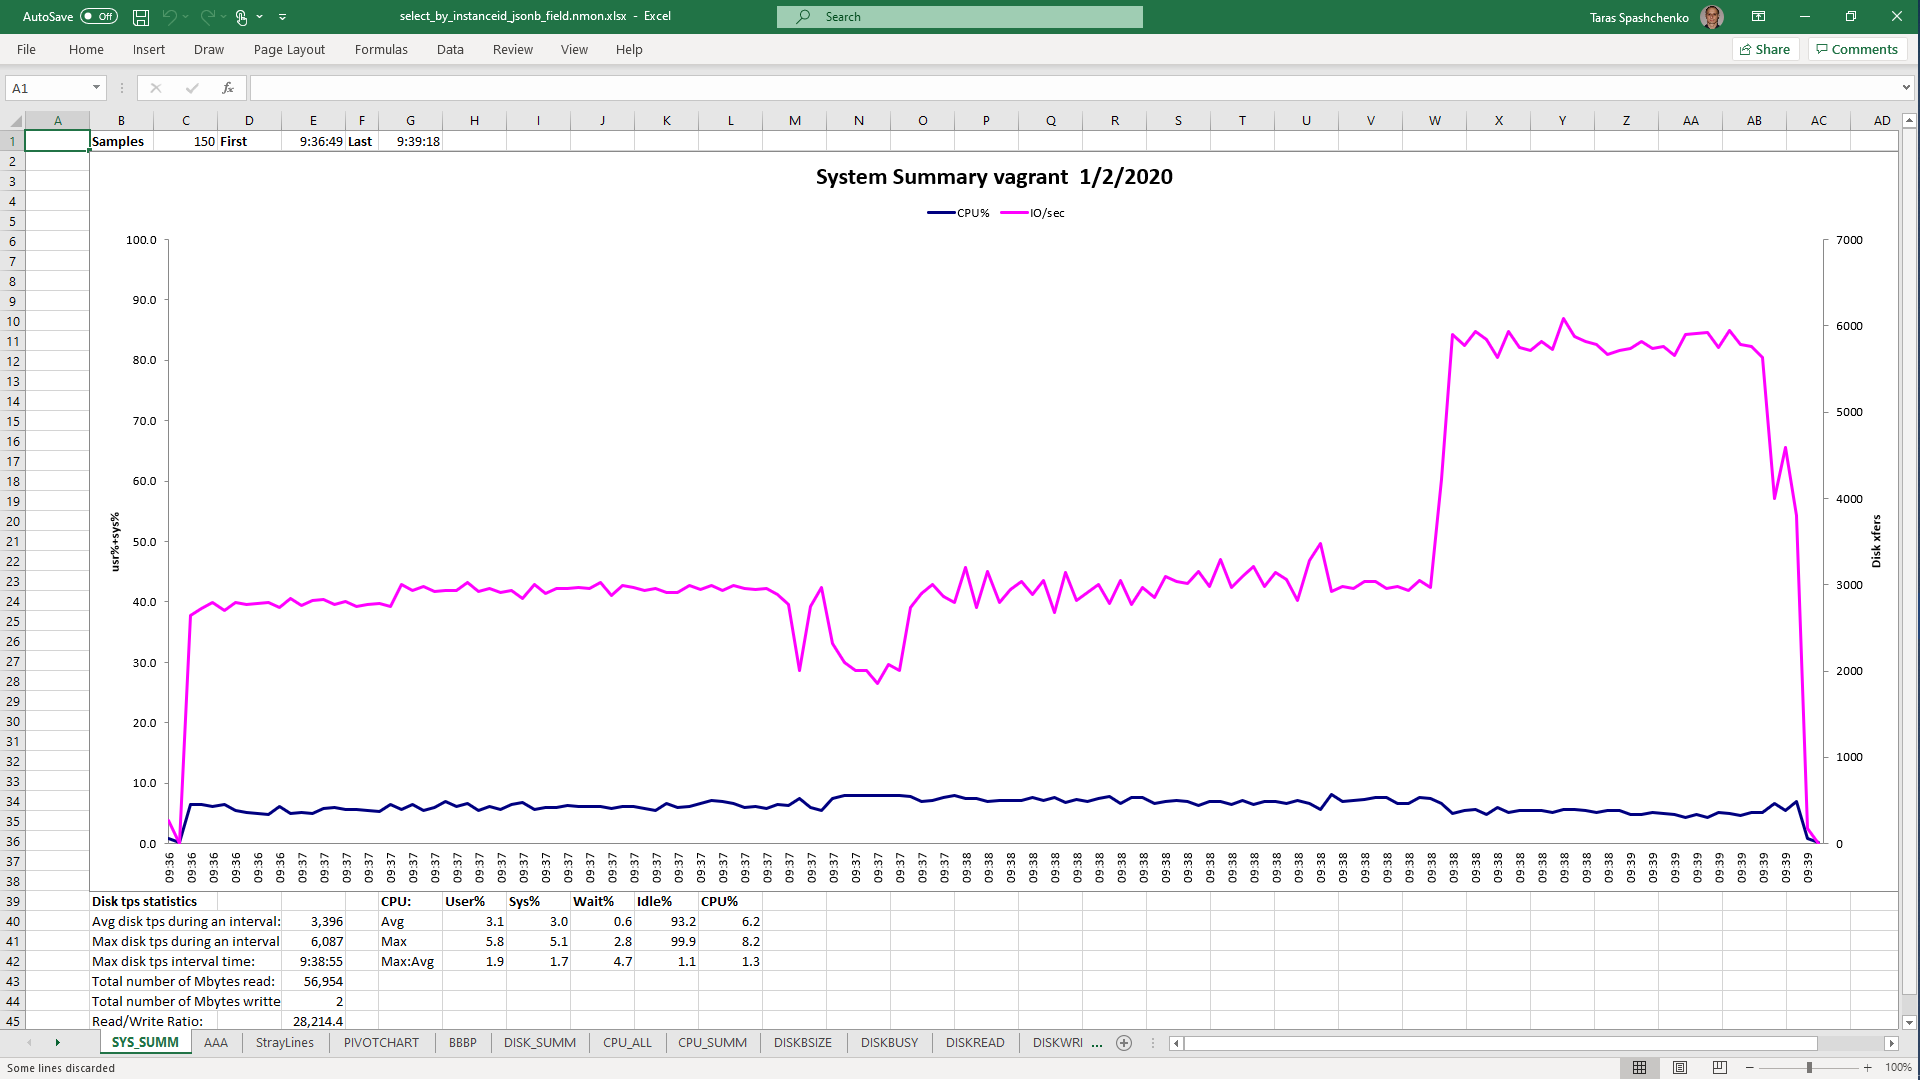
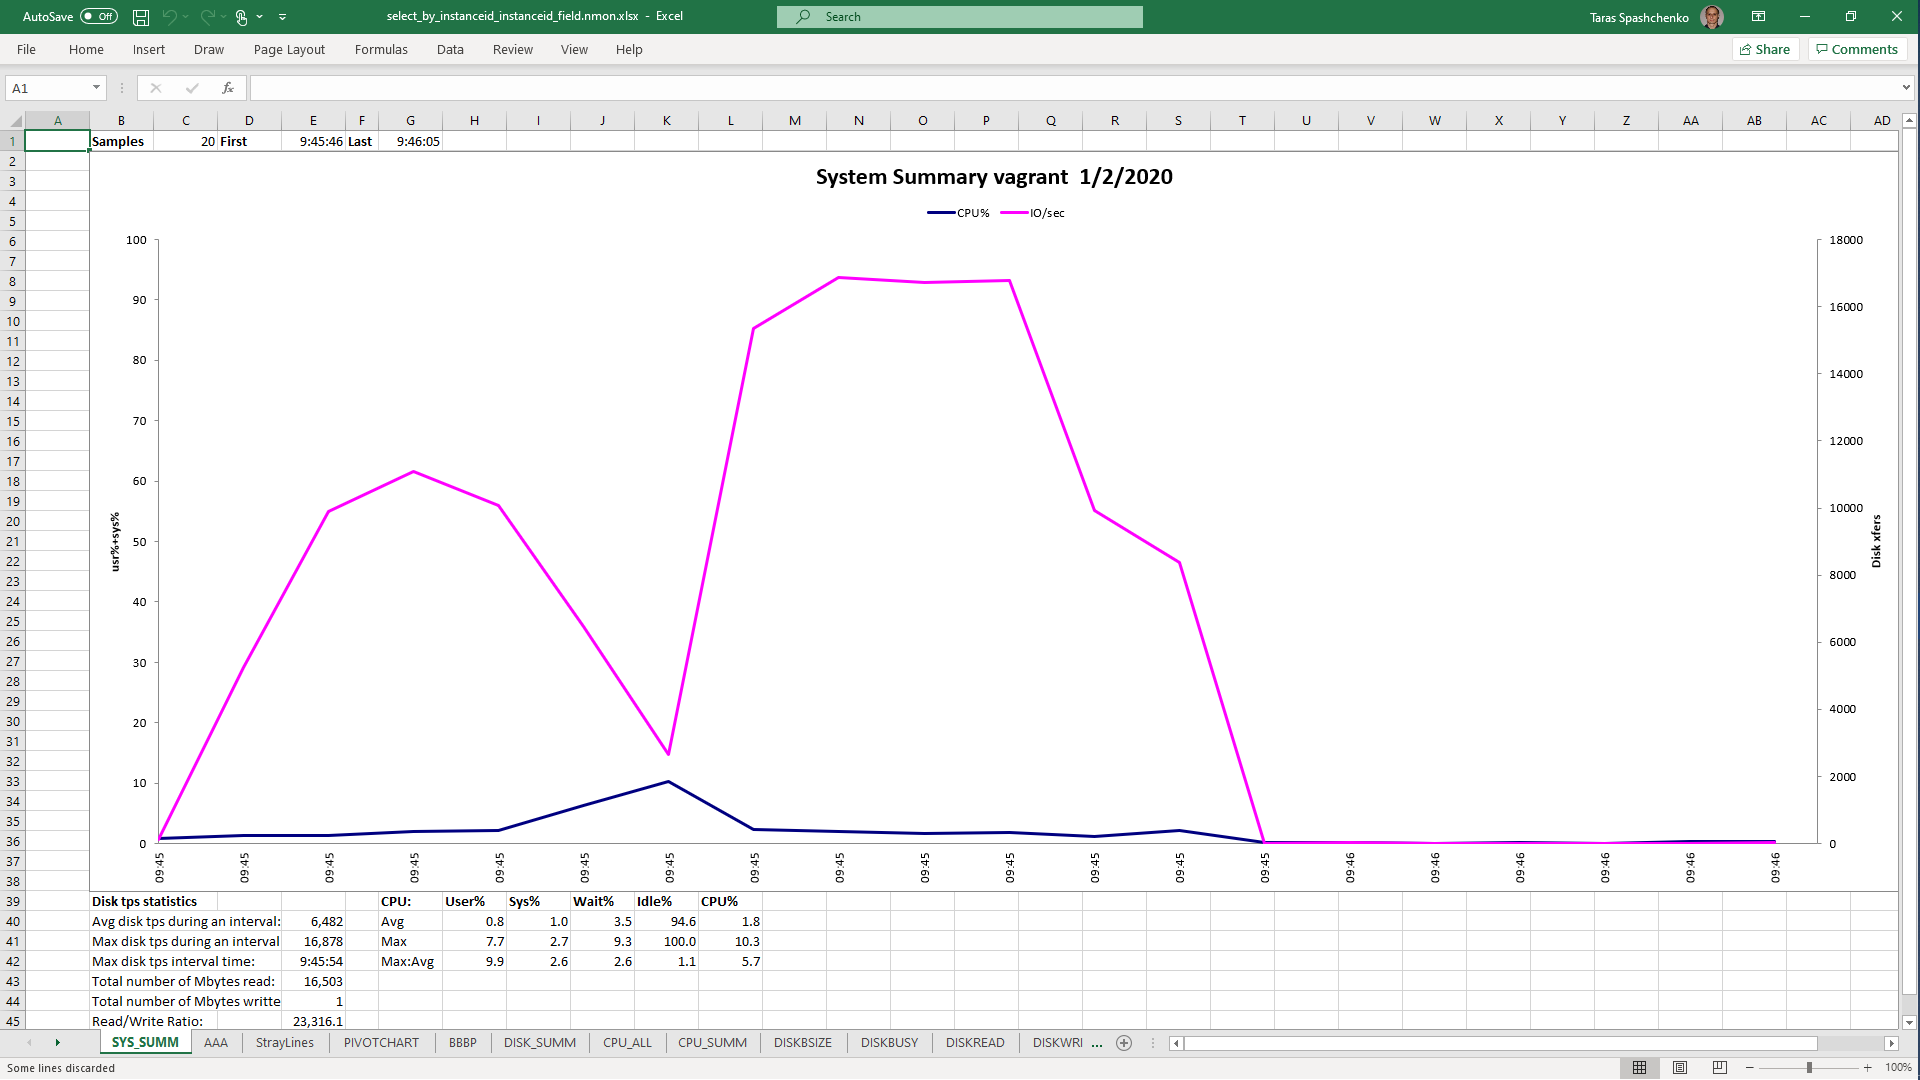
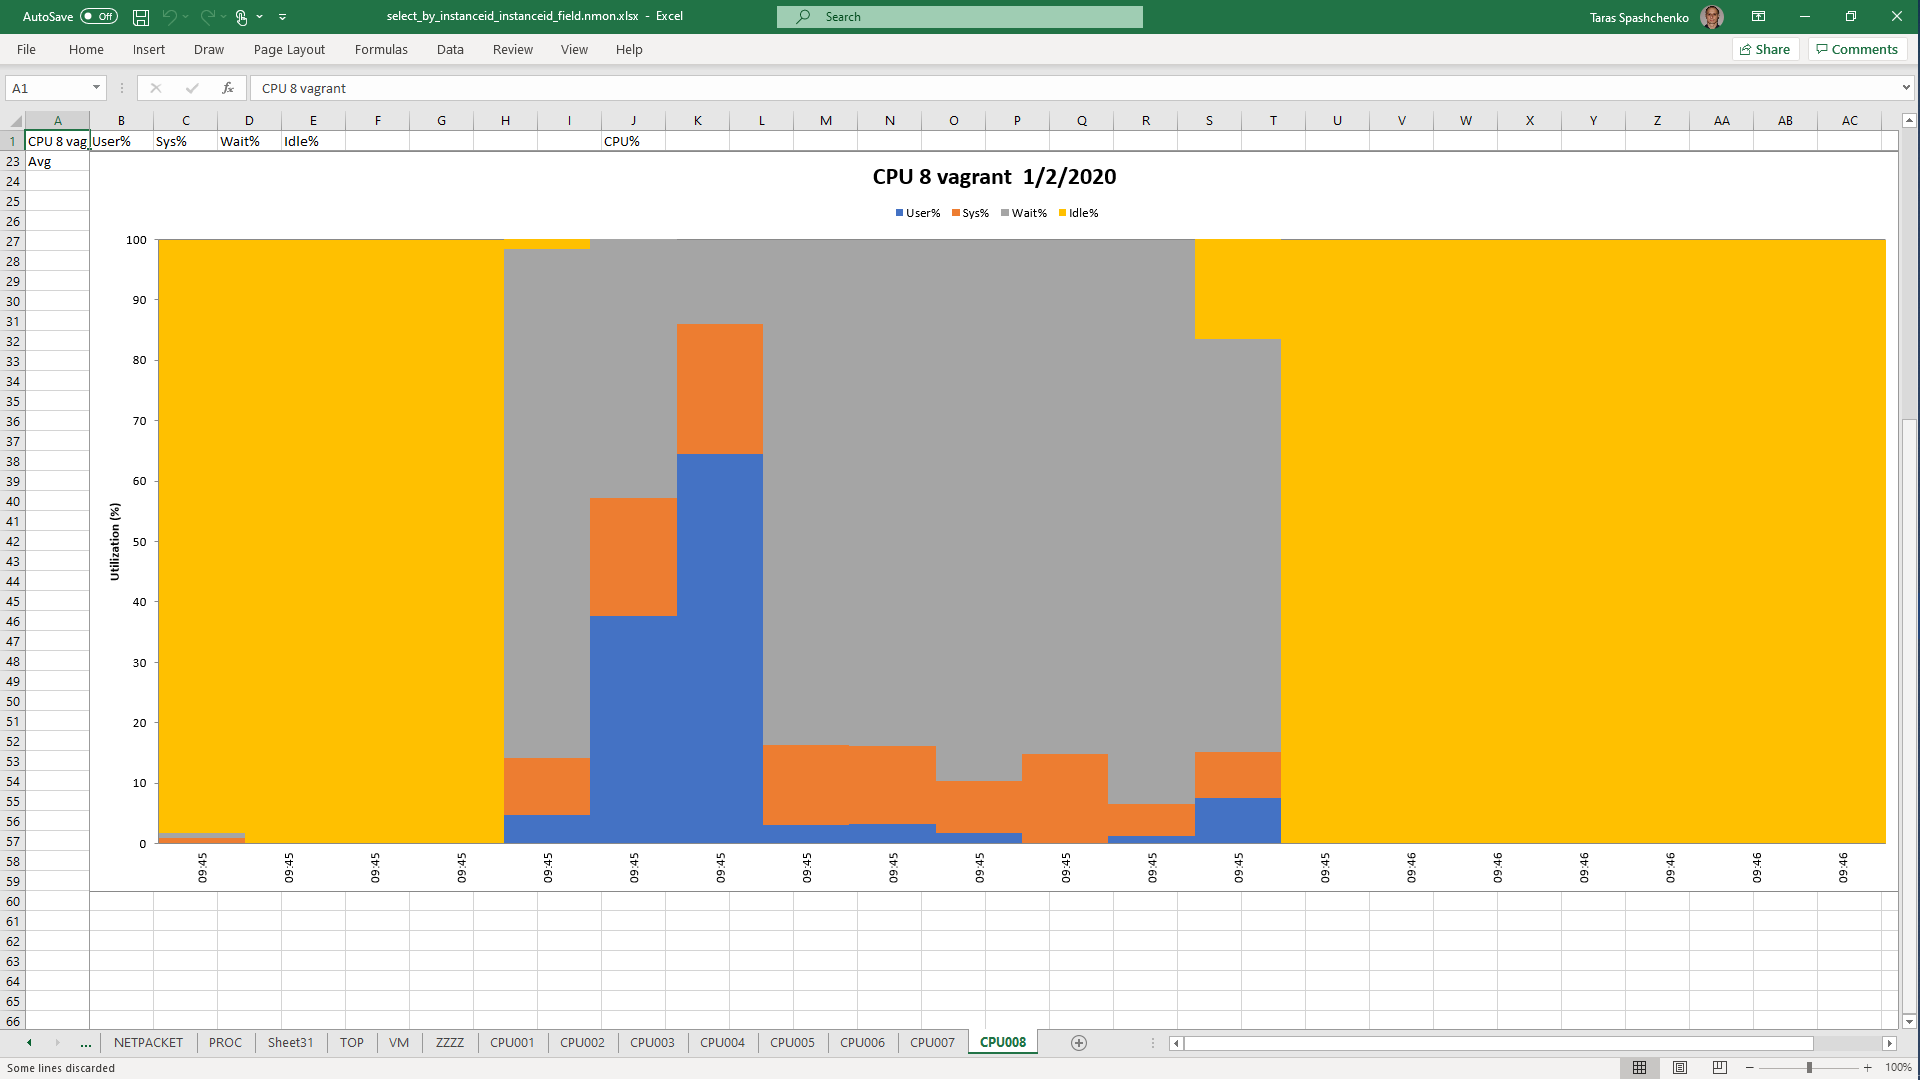
1.2 select * From diku_mod_source_record_storage.marc_records where instanceid = 'fff787ec-7cd7-4acd-8709-c1a842786607'::uuid
1 row retrieved starting from 1 in 11 s 788 ms (execution: 11 s 746 ms, fetching: 42 ms)
Gather  (cost=1000.00..1307470.59 rows=1 width=708) (actual time=10002.821..10012.971 rows=1 loops=1)
  Workers Planned: 2
  Workers Launched: 2
  ->  Parallel Seq Scan on marc_records  (cost=0.00..1306470.49 rows=1 width=708) (actual time=8209.680..9991.160 rows=0 loops=3)
        Filter: (instanceid = 'fff787ec-7cd7-4acd-8709-c1a842786607'::uuid)
        Rows Removed by Filter: 3714076
Planning time: 0.129 ms
Execution time: 10013.014 ms
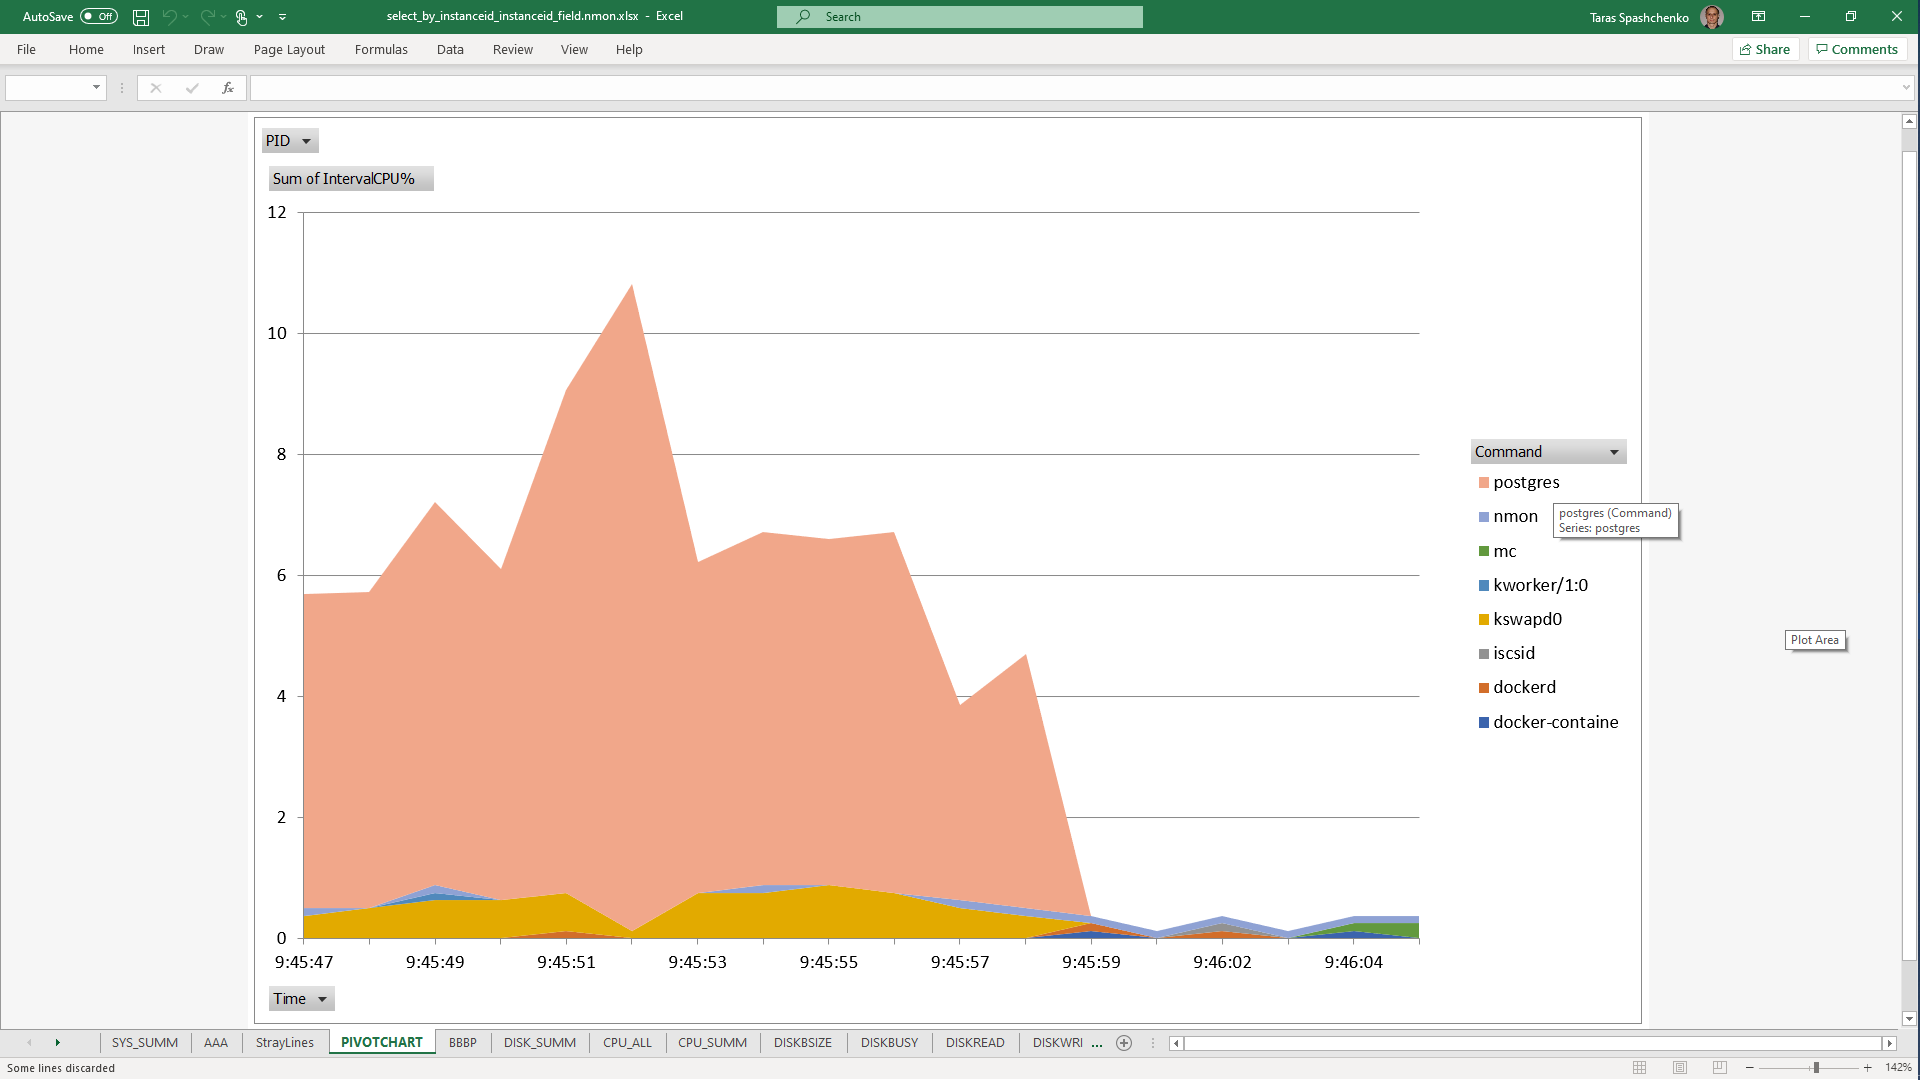
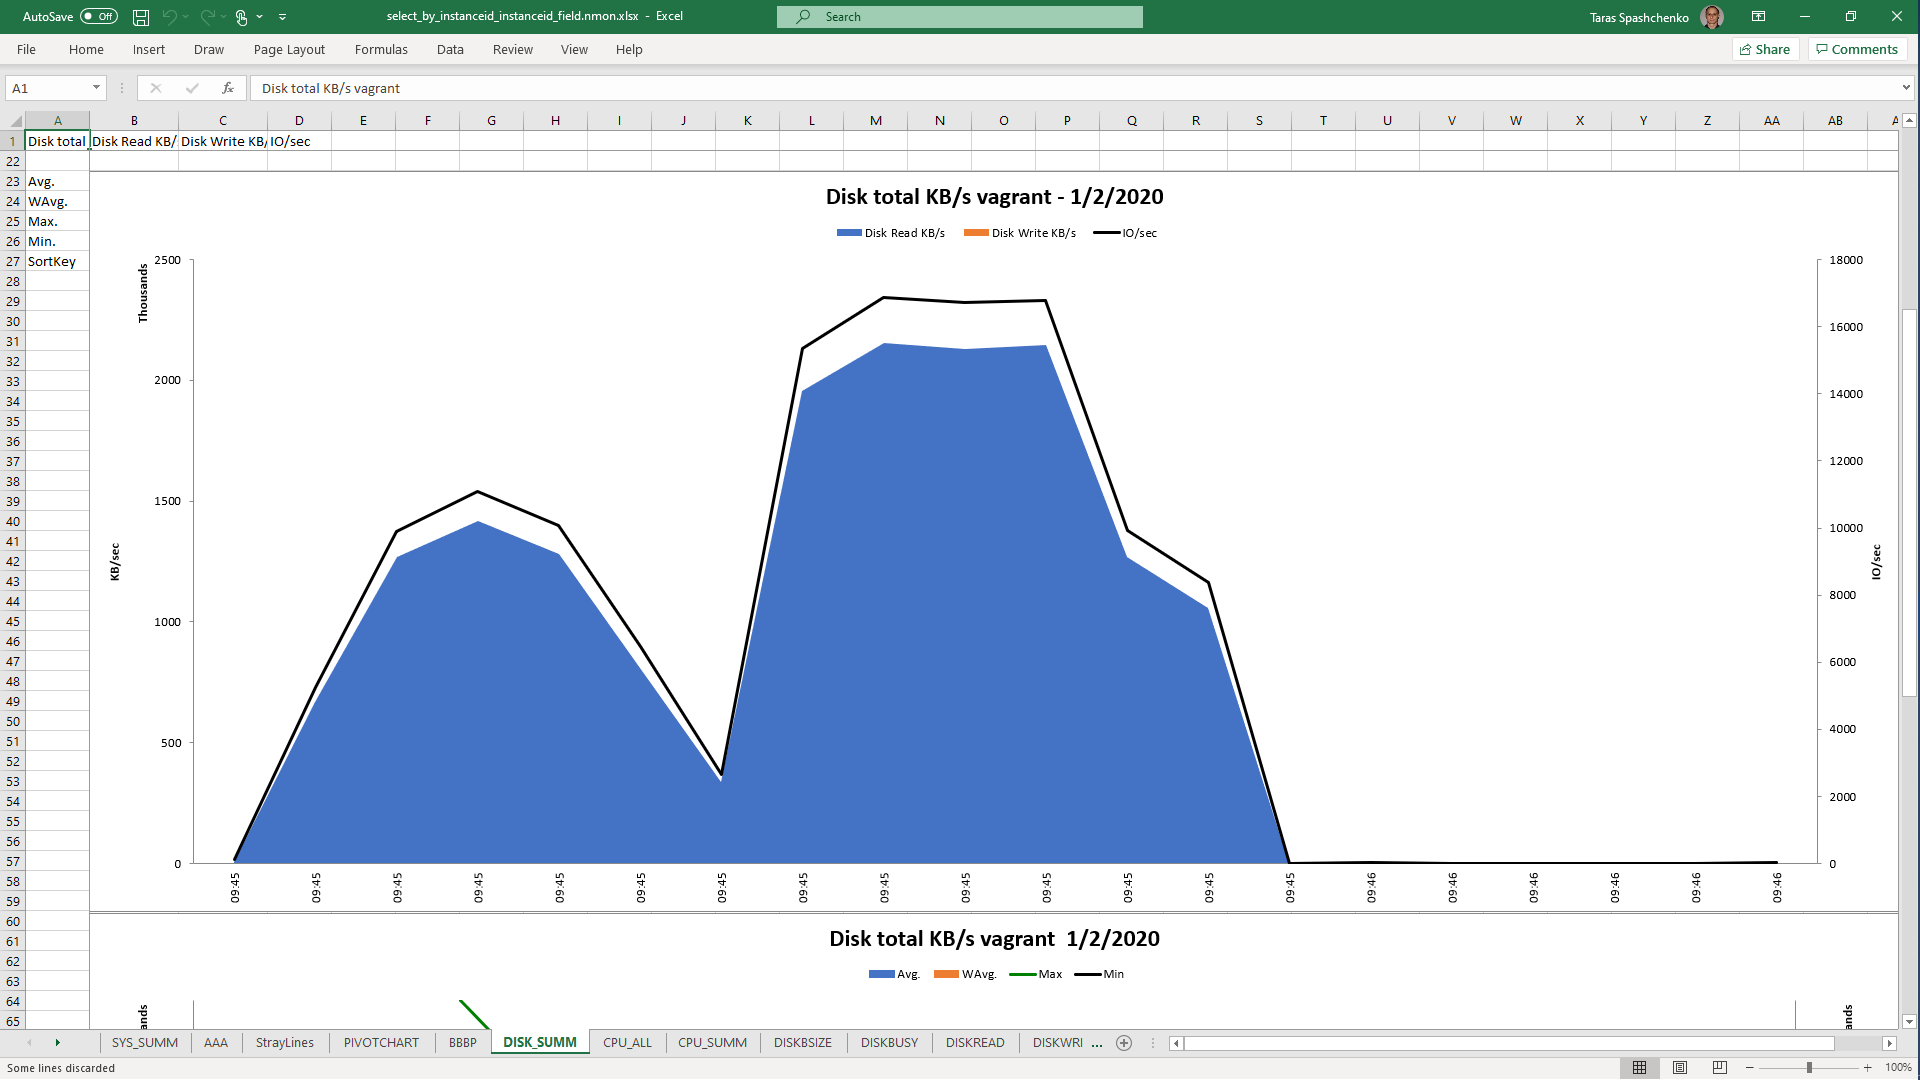
DB Server resources utilization statistics
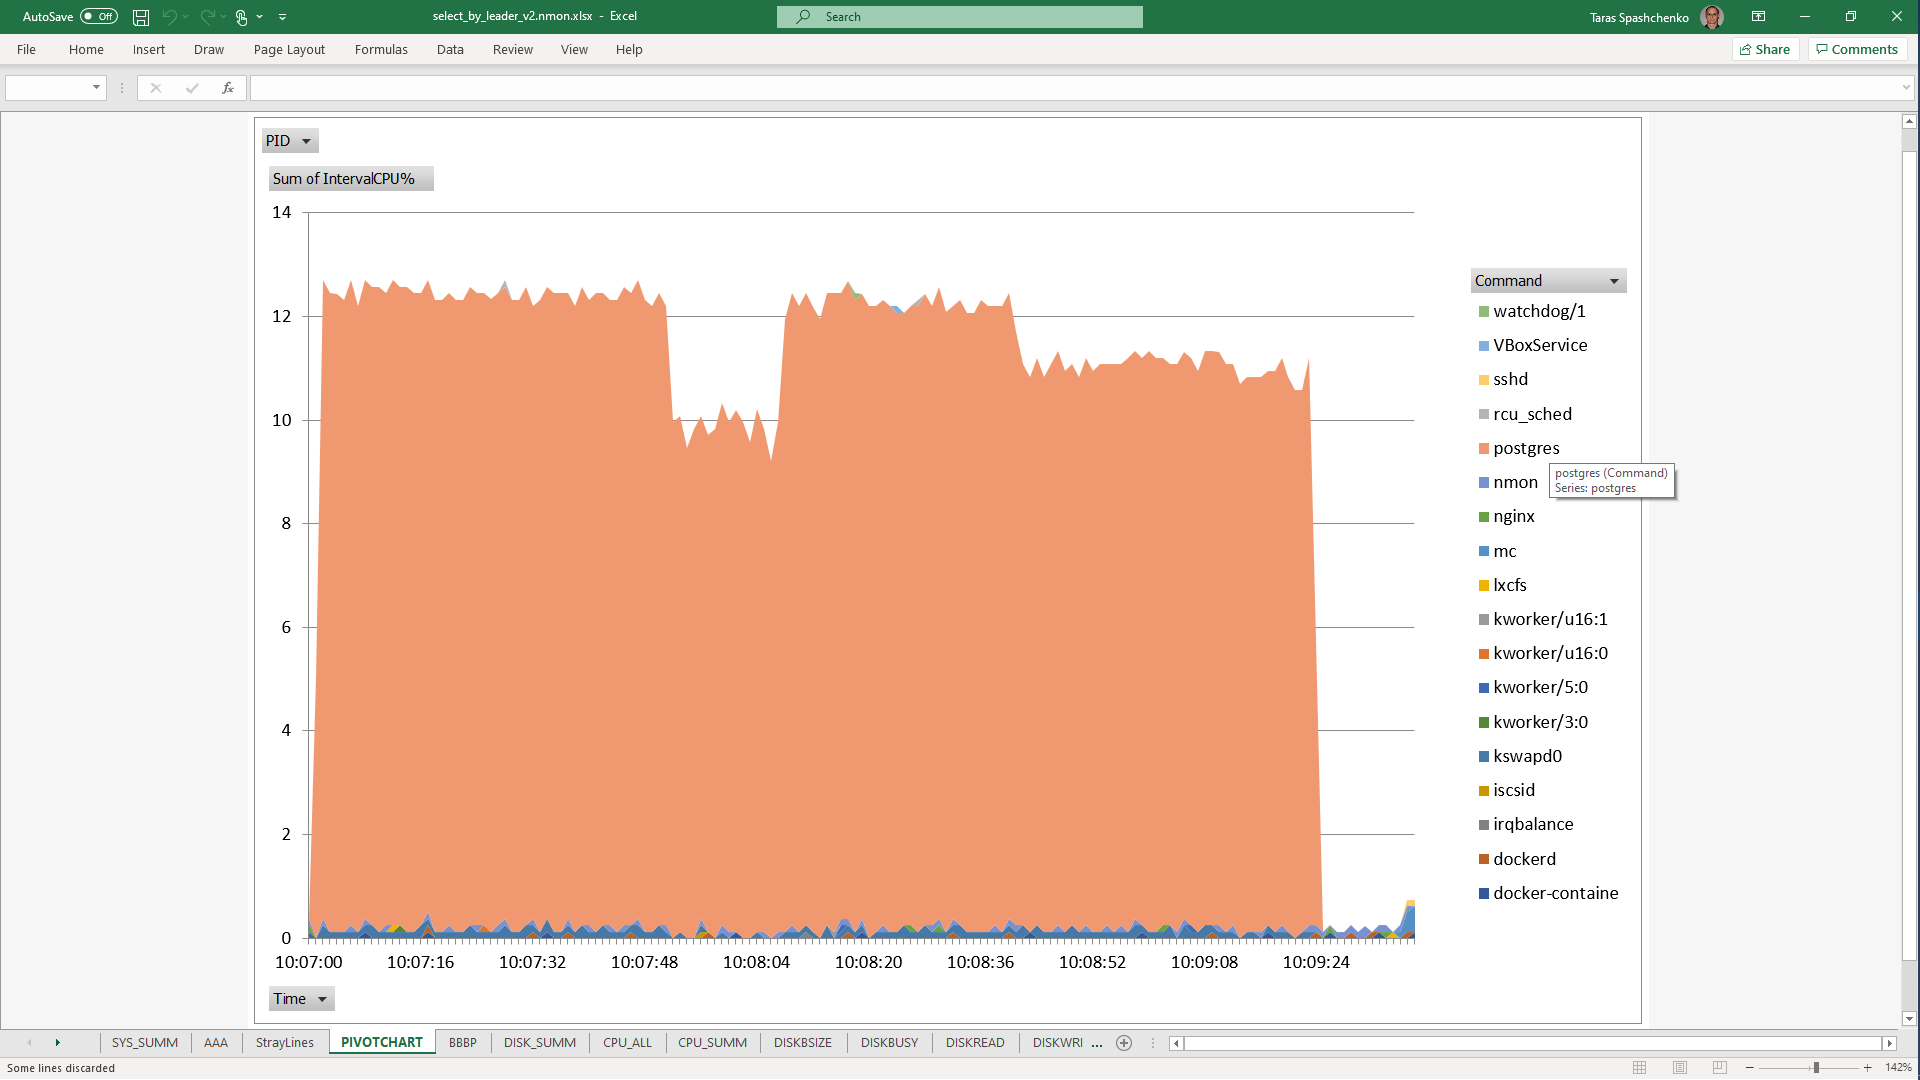
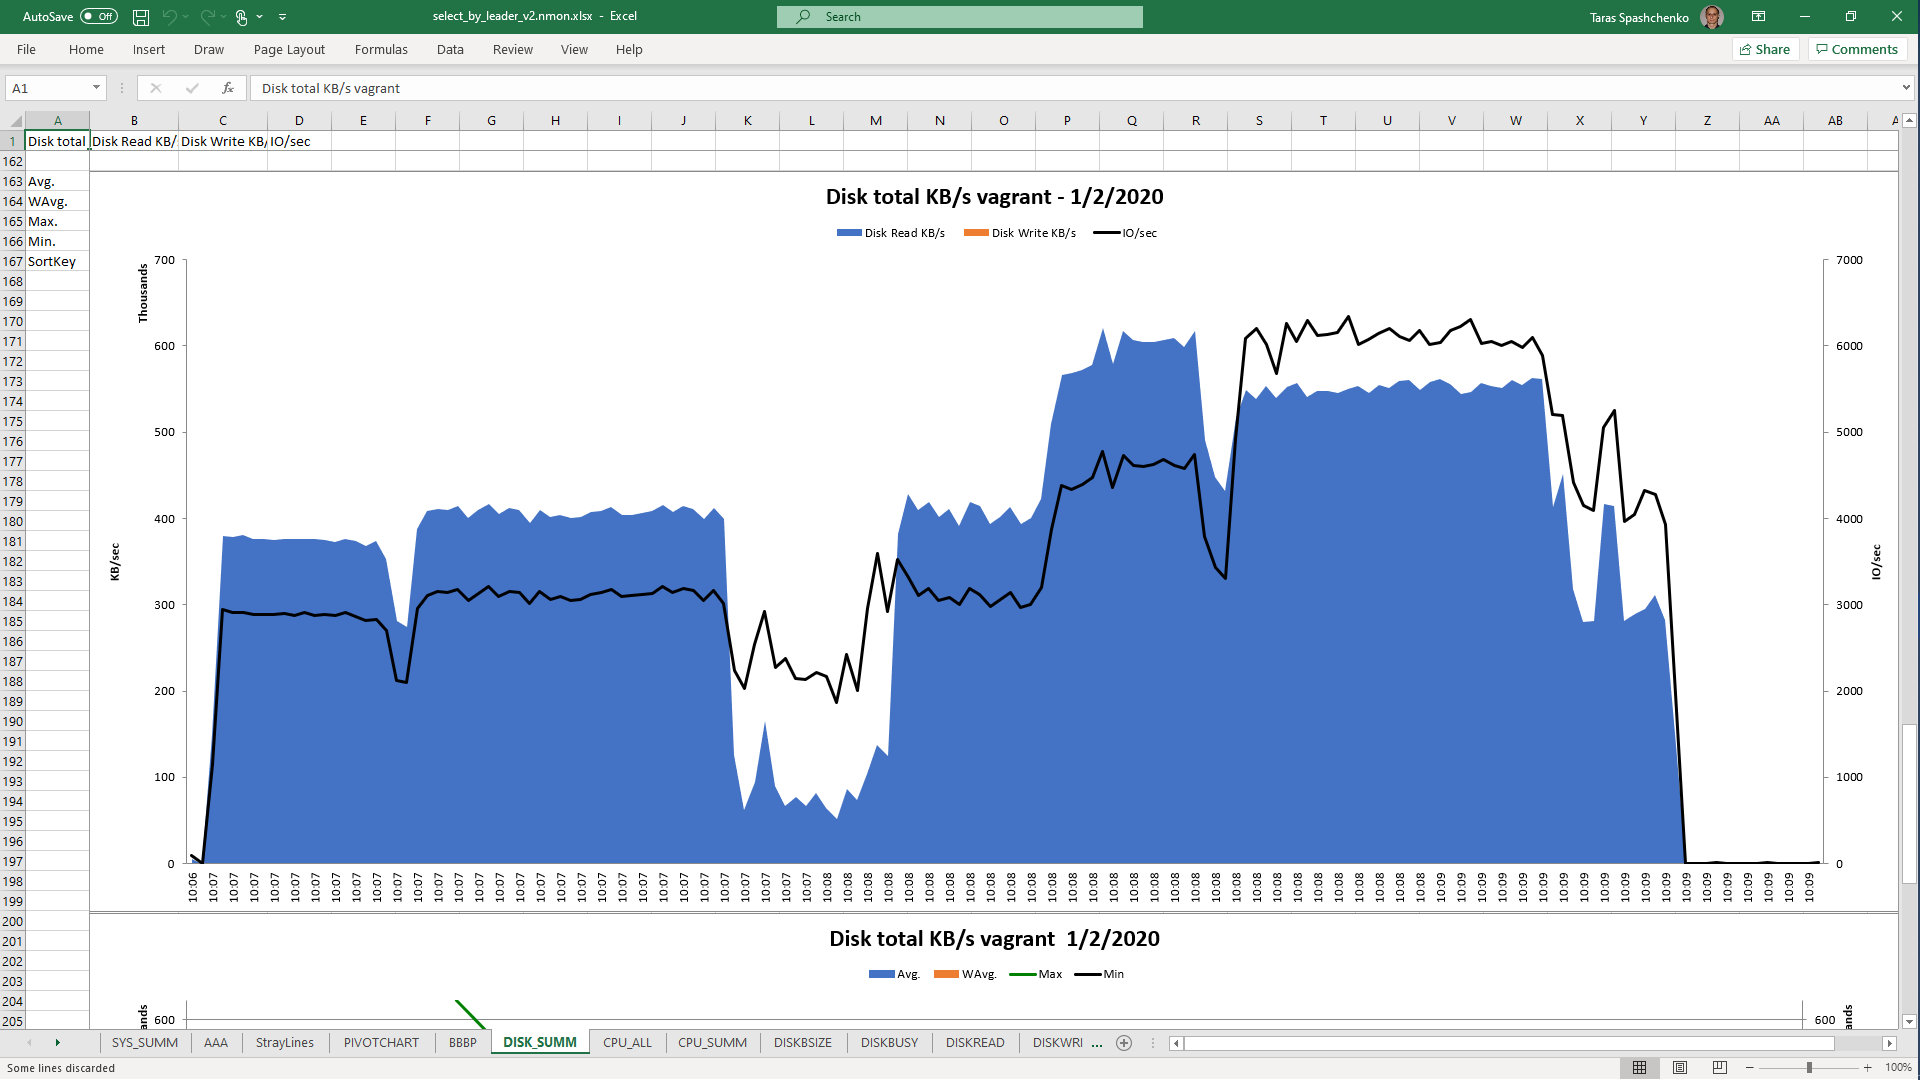
1.3 select x.* from diku_mod_source_record_storage.marc_records x where content @> '{"leader": "01780nam 2200421 i 4500"}'
12 rows retrieved starting from 1 in 2 m 30 s 569 ms (execution: 2 m 30 s 541 ms, fetching: 28 ms)
Gather  (cost=1000.00..1308788.02 rows=12854 width=740) (actual time=9169.500..65617.893 rows=12 loops=1)
  Workers Planned: 2
  Workers Launched: 2
  ->  Parallel Seq Scan on marc_records x  (cost=0.00..1306483.88 rows=5356 width=740) (actual time=10184.573..65351.158 rows=4 loops=3)
        Filter: (content @> '{"leader": "01780nam  2200421 i 4500"}'::jsonb)
        Rows Removed by Filter: 3714072
Planning time: 0.125 ms
Execution time: 65617.946 ms
DB Server resources utilization statistics
1.4 select x.* from diku_mod_source_record_storage.marc_records x where x.content ->> 'leader' = '01780nam 2200421 i 4500'
12 rows retrieved starting from 1 in 2 m 23 s 678 ms (execution: 2 m 23 s 648 ms, fetching: 30 ms)
Gather  (cost=1000.00..1327447.06 rows=64268 width=740) (actual time=4813.635..79709.979 rows=12 loops=1)
  Workers Planned: 2
  Workers Launched: 2
  ->  Parallel Seq Scan on marc_records x  (cost=0.00..1319926.53 rows=26778 width=740) (actual time=24442.768..79424.097 rows=4 loops=3)
        Filter: ((content ->> 'leader'::text) = '01780nam  2200421 i 4500'::text)
        Rows Removed by Filter: 3714072
Planning time: 0.151 ms
Execution time: 79710.036 ms
DB Server resources utilization statistics
1.5 Notes
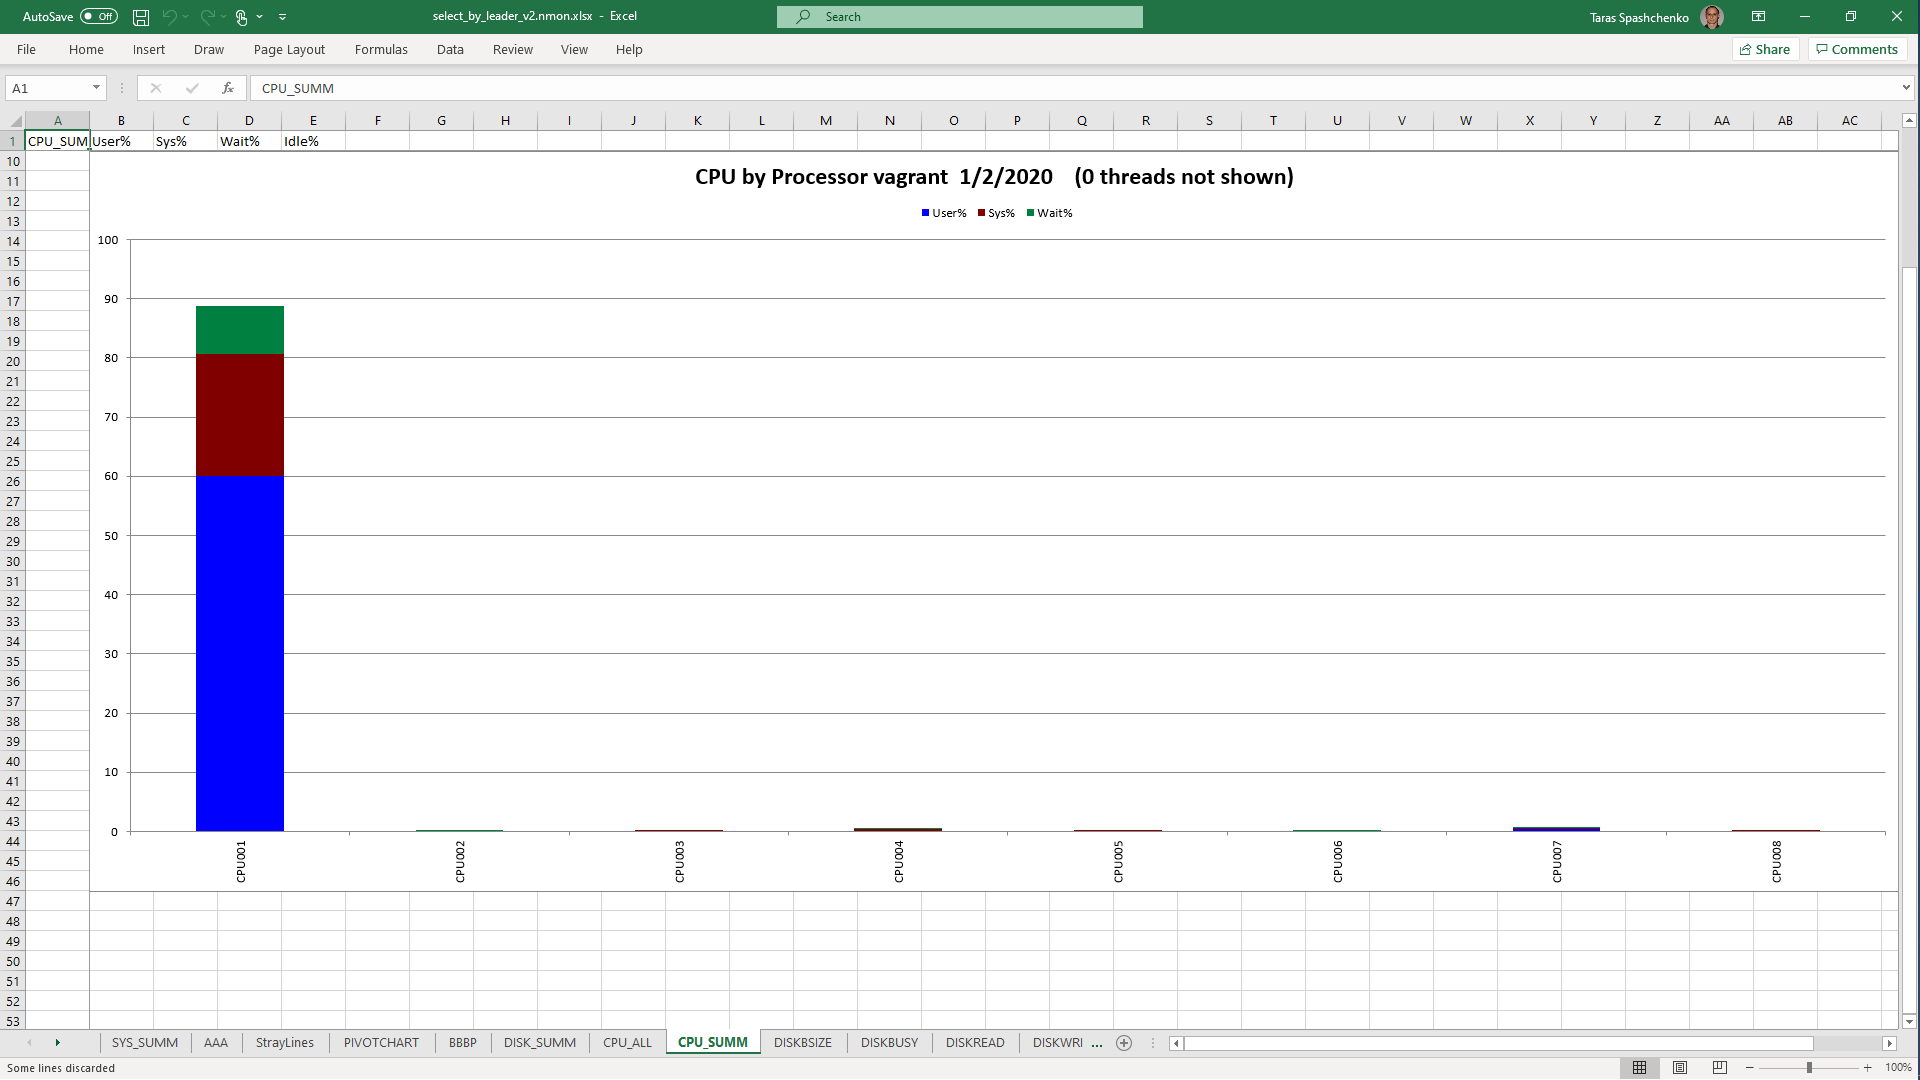
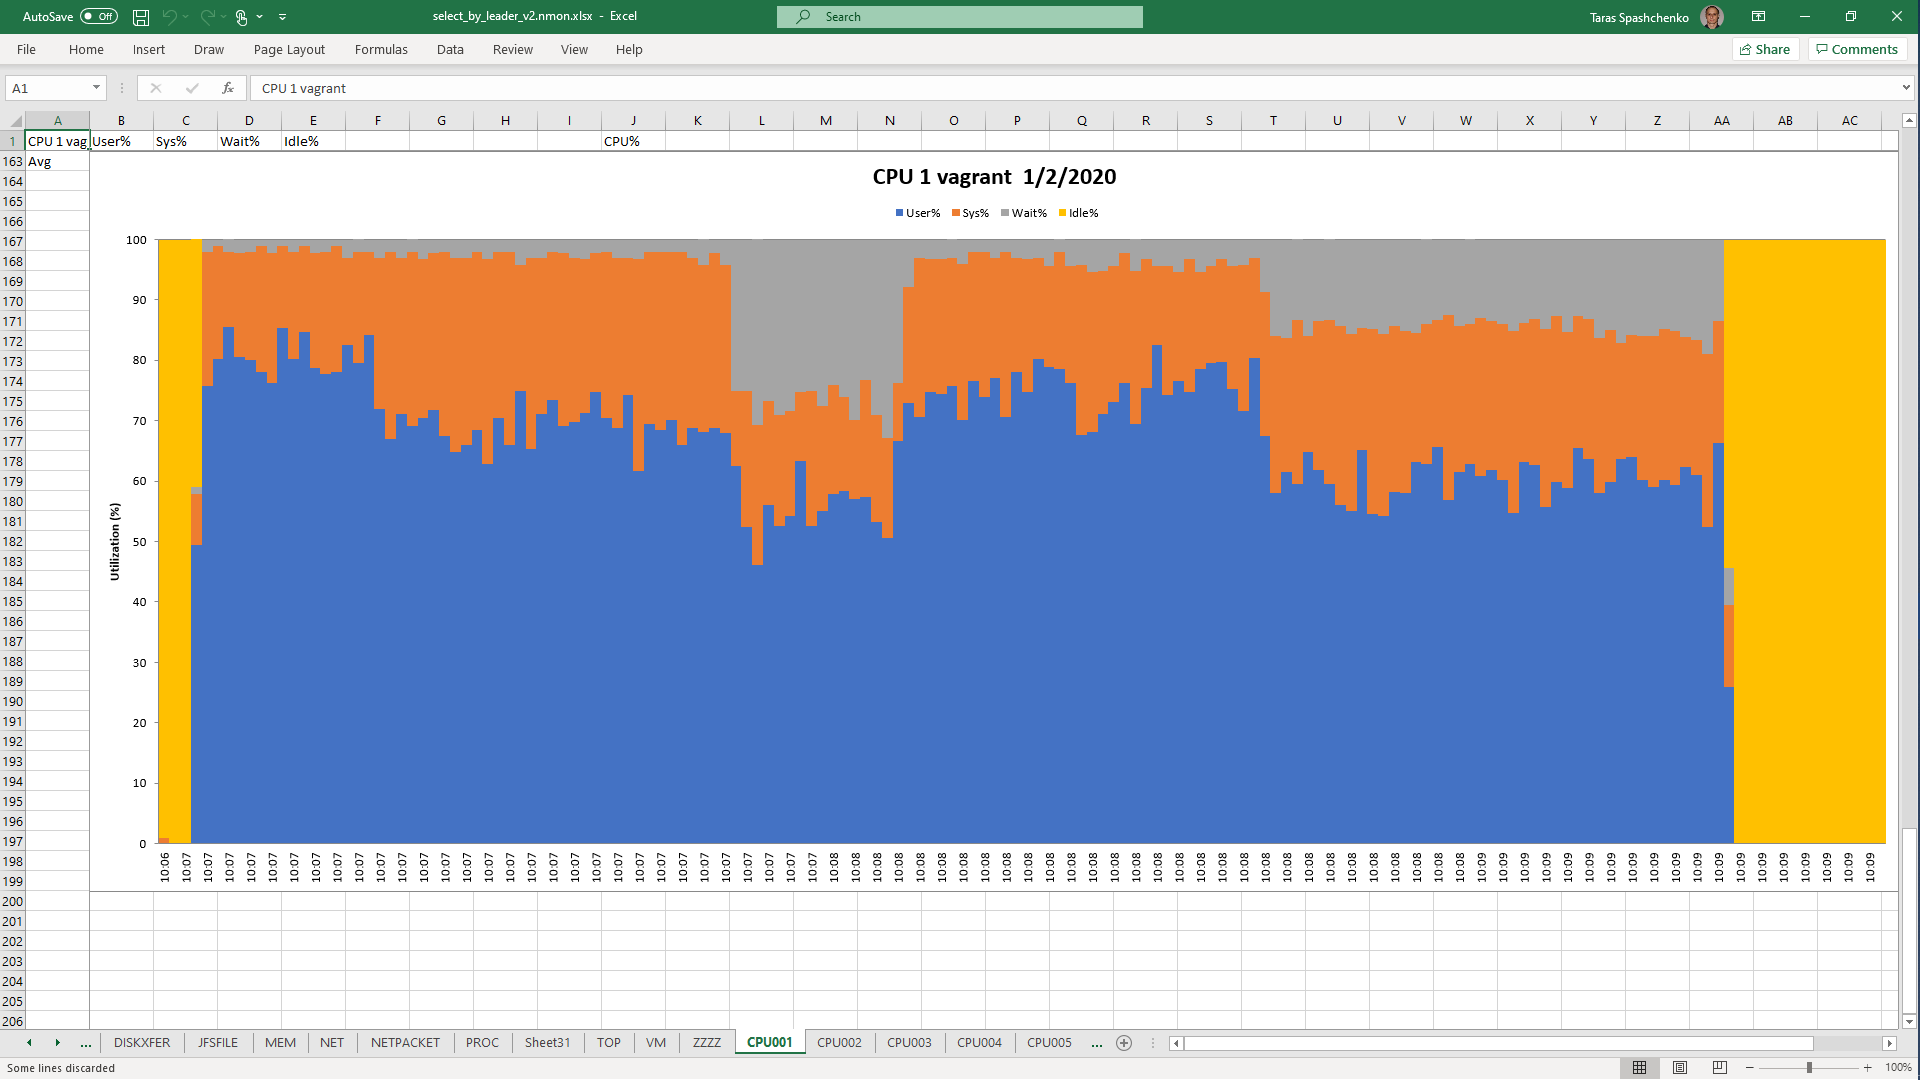
Although, Explain Analyze shows that a parallel scan should be used for all queries, based on the CPU utilization charts we can conclude that in reality, it is not parallel.
Based on the charts and graphs above, it is safe to say, that all JSONB operations in PostgreSQL are quite CPU consuming. If JSONB computations are in Where clause it also increases disk reads and execution time.
2 Indexes
A large portion of SQL queries performed in the database are generated based on the CQL expressions and it means that those could be very diverse and it is almost impossible to create a quite effective index to be used for all cases.
Btree indexes are quite effective. If there is an index for content ->> 'leader' like
create index concurrently idx_marc_records_jsonb_leader on diku_mod_source_record_storage.marc_records ((content ->> 'leader'));
statement 1.4 execution time decreases significantly:
12 rows retrieved starting from 1 in 502 ms (execution: 481 ms, fetching: 21 ms)
Bitmap Heap Scan on marc_records x  (cost=1788.32..186439.78 rows=55711 width=740) (actual time=0.175..0.965 rows=12 loops=1)
  Recheck Cond: ((content ->> 'leader'::text) = '01780nam  2200421 i 4500'::text)
  Heap Blocks: exact=12
  ->  Bitmap Index Scan on idx_marc_records_jsonb_leader  (cost=0.00..1774.39 rows=55711 width=0) (actual time=0.073..0.073 rows=12 loops=1)
        Index Cond: ((content ->> 'leader'::text) = '01780nam  2200421 i 4500'::text)
Planning time: 0.194 ms
Execution time: 1.034 ms
But btree indexes are narrow and usually are not used with OR conjunctions. Also, they have some impact on insert/update performance. It is not significant but if there are several btree indexes for a table performance degradation can be perceptible. And indexes require additional disk space to be stored.
Hash indexes have a significant impact on the insert/update performance and I would recommend it to use only for tables that are changed rarely. But they require less space compared to Btree indexes.
GIN indexes are space consuming and will not be used for queries generated from CQL expressions. If there is a GIN index like
CREATE INDEX idx_marc_records_jsonb_ops ON diku_mod_source_record_storage.marc_records USING GIN (content jsonb_ops);
statement 1.3 execution decreases in times:
12 rows retrieved starting from 1 in 1 s 112 ms (execution: 553 ms, fetching: 559 ms)
Bitmap Heap Scan on marc_records x  (cost=170.35..41561.25 rows=11142 width=740) (actual time=1.286..2.655 rows=12 loops=1)
  Recheck Cond: (content @> '{"leader": "01780nam  2200421 i 4500"}'::jsonb)
  Heap Blocks: exact=12
  ->  Bitmap Index Scan on idx_marc_records_jsonb_ops  (cost=0.00..167.57 rows=11142 width=0) (actual time=1.016..1.016 rows=12 loops=1)
        Index Cond: (content @> '{"leader": "01780nam  2200421 i 4500"}'::jsonb)
Planning time: 0.177 ms
Execution time: 2.727 ms
But this index is not used for statements like 1.4
Full-text search indexes are not suitable as well for CQL generated queries.
2.1 Disk space usage
Below there is a table that represents disk space usage by marc_records table and indexes created for that table.
| marc_records | 9684 MB | table contains 11142228 rows | ||
| pk_marc_records | 372 MB | unique index for primary key (id) | BTree | |
| idx_marc_records_instanceid | 305 MB | index for InstanceId column | BTree | |
| idx_marc_records_jsonb_leader | 529 MB | index for (content ->> 'leader') expression | BTree | |
| idx_marc_records_jsonb_ops | 8708 MB | GIN index for content with jsonb_ops class | GIN |
3. JSONB columns are TOASTed
PostgreSQL uses TOAST technique to store large fields, JSONB in particular. To make story short it means that a separate (so called TOASTed) table is used to store JSONB fields. Only references to rows in the TOASTed table are stored in the main table.
You can easily check that almost all tables in FOLIO platform have their TOASTed counterparts using this SQL query.
select t1.oid     rel_oid,
       t2.oid     toast_iod,
       t1.relname rel_name,
       t1.relkind rel_kind,
       t2.relname toast_name,
       t2.relkind toast_kind
from pg_class t1
         inner join pg_class t2
                    on t1.reltoastrelid = t2.oid
where t1.relkind = 'r'
  and t2.relkind = 't'
order by t1.relname;
Also, values stored in TOASTed tables can be compressed as described in the documentation:
...
PostgreSQL uses a fixed page size (commonly 8 kB), and does not allow tuples to span multiple pages. Therefore, it is not possible to store very large field values directly. To overcome this limitation, large field values are compressed and/or broken up into multiple physical rows. This happens transparently to the user, with only small impact on most of the backend code. The technique is affectionately known as TOAST (or “the best thing since sliced bread”).
...
The TOAST management code is triggered only when a row value to be stored in a table is wider than TOAST_TUPLE_THRESHOLD bytes (normally 2 kB). The TOAST code will compress and/or move field values out-of-line until the row value is shorter than TOAST_TUPLE_TARGET bytes (also normally 2 kB, adjustable) or no more gains can be had.
...
This scheme has a number of advantages compared to a more straightforward approach such as allowing row values to span pages. Assuming that queries are usually qualified by comparisons against relatively small key values, most of the work of the executor will be done using the main row entry. The big values of TOASTed attributes will only be pulled out (if selected at all) at the time the result set is sent to the client. Thus, the main table is much smaller and more of its rows fit in the shared buffer cache than would be the case without any out-of-line storage. Sort sets shrink also, and sorts will more often be done entirely in memory. A little test showed that a table containing typical HTML pages and their URLs was stored in about half of the raw data size including the TOAST table, and that the main table contained only about 10% of the entire data (the URLs and some small HTML pages). There was no run time difference compared to an un-TOASTed comparison table, in which all the HTML pages were cut down to 7 kB to fit.
So PostgreSQL has to not only read an additional table to retrieve JSONB fields but also perform additional computations to decompress original data and only after that it can apply a function to JSONB value or make a comparison.
Thus, a "simpe" table scan for a TOASTed table becomes a quite complex operation because PostrgreSQL has to perform a set of actions:
- Read the next datablock from the disk for the main table (blocks read during table scans are not pinned to the shared cache for large tables)
- Perform an index scan for a TOASTed counterpart to find rows that relate to the row in the main table (index blocks can be either in the shared cache or not)
- Retrieve all those rows that contain a JSONB value (in most cases db blocks must be read from disk)
- Decompress the value of needed and apply a function or make a comparison to the value
Below are detailed “EXPLAIN ANALYZE” for two SQL queries to the same table. The first one uses a search condition with the JSONB field. The second one uses just a plain field in a search condition.
1.
EXPLAIN (ANALYZE, COSTS, VERBOSE, BUFFERS, FORMAT TEXT)
select * From diku_mod_source_record_storage.marc_records where content #>> '{fields, 33, 999, subfields, 0, i}' = '3dba7c3a-2bd1-4b47-b44c-25ff91fa6308';
Gather  (cost=1000.00..1315735.03 rows=55711 width=823) (actual time=81722.406..81998.422 rows=1 loops=1)
  Output: id, content, instanceid
  Workers Planned: 2
  Workers Launched: 2
  Buffers: shared hit=23246857 read=3371323
  ->  Parallel Seq Scan on diku_mod_source_record_storage.marc_records  (cost=0.00..1309163.93 rows=23213 width=823) (actual time=70081.439..81712.424 rows=0 loops=3)
        Output: id, content, instanceid
        Filter: ((marc_records.content #>> '{fields,33,999,subfields,0,i}'::text[]) = '3dba7c3a-2bd1-4b47-b44c-25ff91fa6308'::text)
        Rows Removed by Filter: 3714076
        Buffers: shared hit=23246857 read=3371323
        Worker 0: actual time=46814.759..81707.713 rows=1 loops=1
          Buffers: shared hit=7626833 read=1101635
        Worker 1: actual time=81707.793..81707.793 rows=0 loops=1
          Buffers: shared hit=7747854 read=1128701
Planning time: 0.163 ms
Execution time: 81998.470 ms
2.
EXPLAIN (ANALYZE, COSTS, VERBOSE, BUFFERS, FORMAT TEXT)
select * From diku_mod_source_record_storage.marc_records where instanceid = 'fff787ec-7cd7-4acd-8709-c1a842786607'::uuid;
Gather  (cost=1000.00..1298557.54 rows=1 width=823) (actual time=6948.502..16626.117 rows=1 loops=1)
  Output: id, content, instanceid
  Workers Planned: 2
  Workers Launched: 2
  Buffers: shared hit=192 read=1239333
  ->  Parallel Seq Scan on diku_mod_source_record_storage.marc_records  (cost=0.00..1297557.44 rows=1 width=823) (actual time=13389.376..16613.601 rows=0 loops=3)
        Output: id, content, instanceid
        Filter: (marc_records.instanceid = 'fff787ec-7cd7-4acd-8709-c1a842786607'::uuid)
        Rows Removed by Filter: 3714076
        Buffers: shared hit=192 read=1239333
        Worker 0: actual time=16610.118..16610.118 rows=0 loops=1
          Buffers: shared hit=74 read=532743
        Worker 1: actual time=16610.121..16610.121 rows=0 loops=1
          Buffers: shared hit=41 read=350884
Planning time: 0.151 ms
Execution time: 16626.160 ms
As you can see for the first query a total amount of db block read (hit + read) is 23,246,857 + 3,371,323 = 26,618,180
For the second query 192 + 1,239,333 = 1,239,525
For comparison this is an "EXPLAIN ANALYSE" for a simple relational table with plain fields that has the same number or rows.
EXPLAIN (ANALYZE, COSTS, VERBOSE, BUFFERS, FORMAT TEXT)
select * From diku_mod_source_record_storage.records where instanceid2 = '698dbbe4-858c-4d27-b182-666a59ec6bca'::uuid;
Gather  (cost=1000.00..273306.54 rows=1 width=158) (actual time=792.961..838.863 rows=1 loops=1)
  Output: id, snapshotid, matchedprofileid, matchedid, generation, recordtype, instanceid, deleted, orderinfile, suppressdiscovery, createdbyuserid, createddate, updatedbyuserid, updateddate, instanceid2
  Workers Planned: 2
  Workers Launched: 2
  Buffers: shared hit=214274
  ->  Parallel Seq Scan on diku_mod_source_record_storage.records  (cost=0.00..272306.44 rows=1 width=158) (actual time=676.055..784.382 rows=0 loops=3)
        Output: id, snapshotid, matchedprofileid, matchedid, generation, recordtype, instanceid, deleted, orderinfile, suppressdiscovery, createdbyuserid, createddate, updatedbyuserid, updateddate, instanceid2
        Filter: (records.instanceid2 = '698dbbe4-858c-4d27-b182-666a59ec6bca'::uuid)
        Rows Removed by Filter: 3714076
        Buffers: shared hit=214274
        Worker 0: actual time=773.911..773.911 rows=0 loops=1
          Buffers: shared hit=70404
        Worker 1: actual time=462.120..787.102 rows=1 loops=1
          Buffers: shared hit=70341
Planning time: 0.313 ms
Execution time: 838.940 ms
shared hit=214274
Here is a quite interesting post regarding hidden costs when working with JSONB
https://heap.io/blog/when-to-avoid-jsonb-in-a-postgresql-schema