logs.ci.folio.org Guide
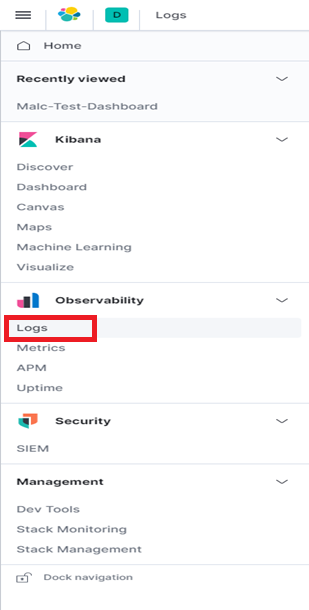
At first, go to the https://logs.ci.folio.org/ and select in the menu “Observability”-> “Logs”
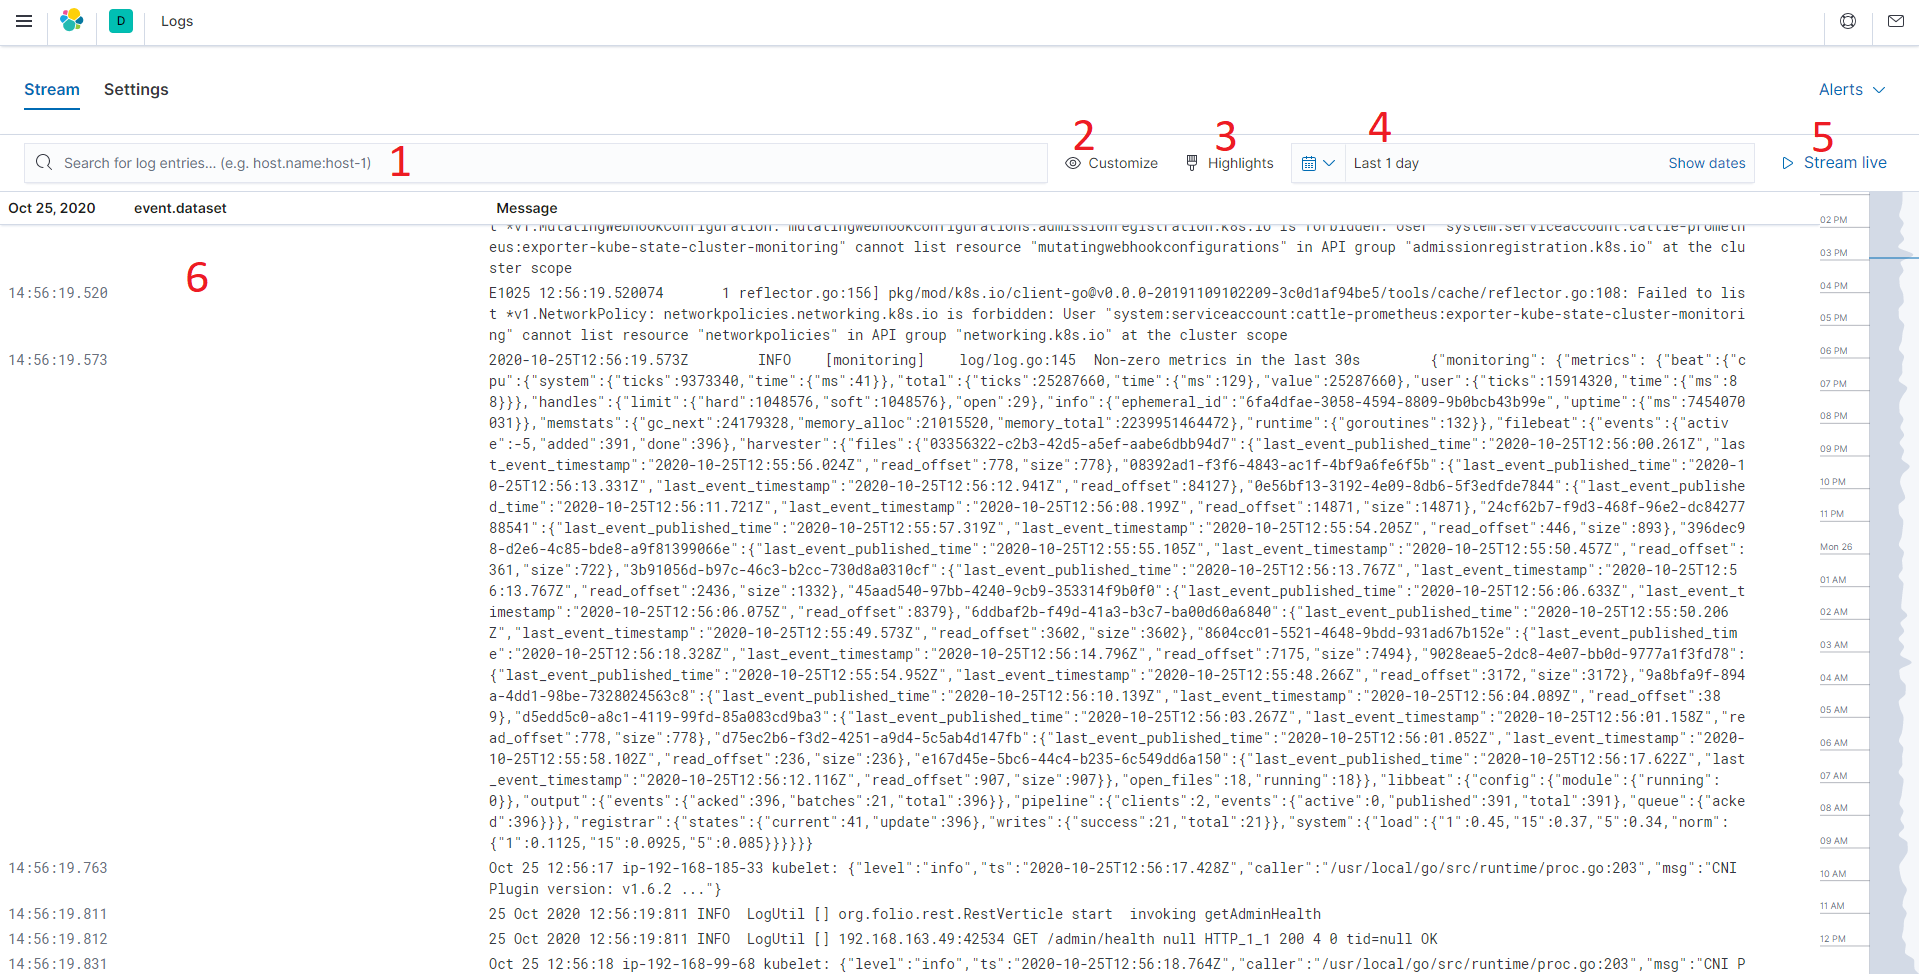
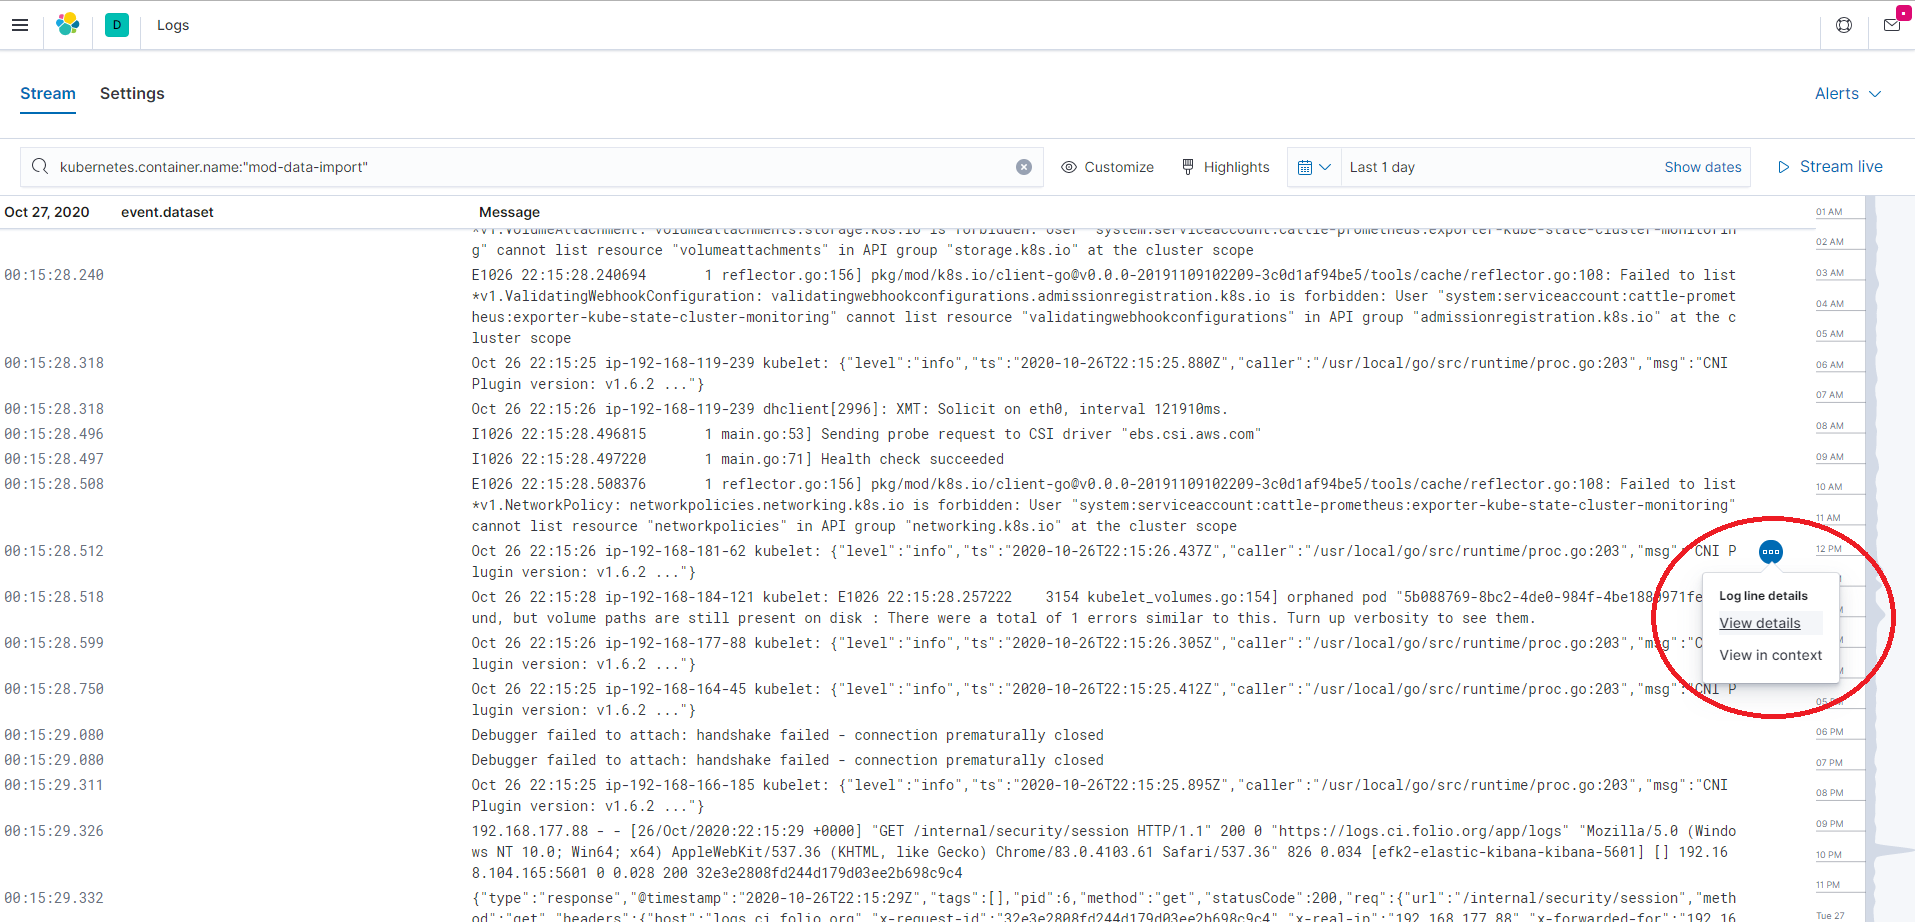
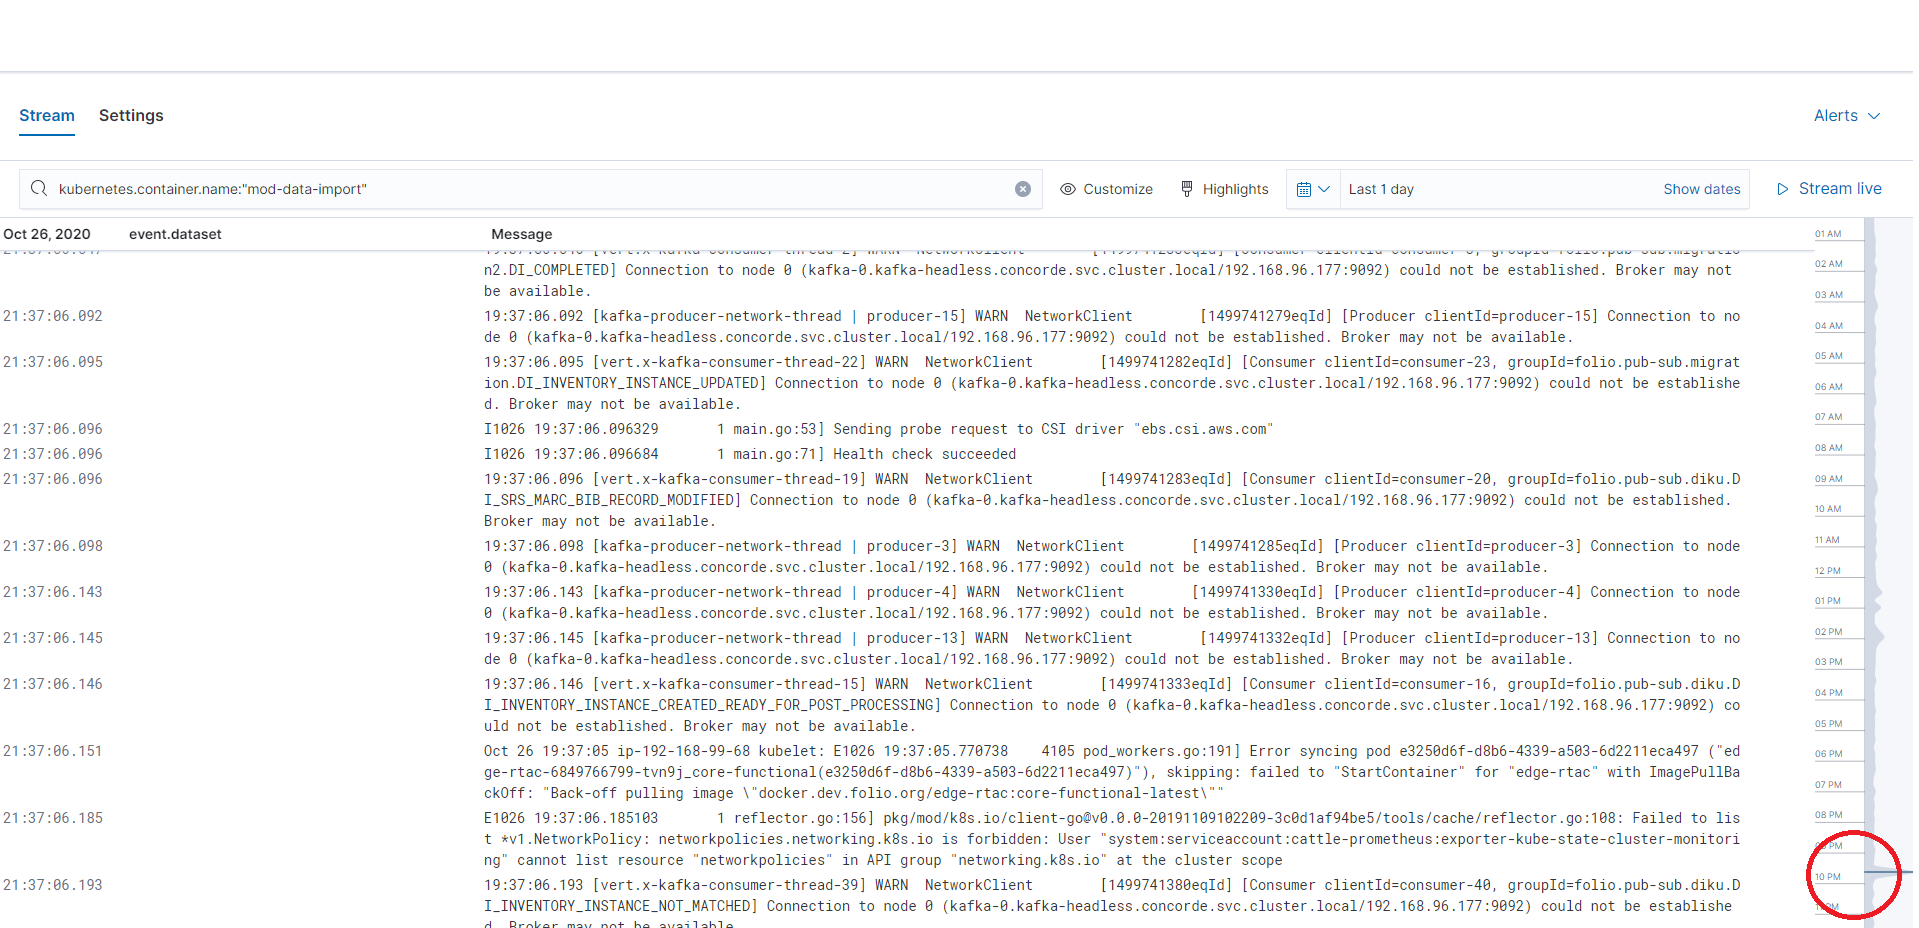
You can see this page:
So there are some useful elements:
1. “Search bar”. You can input search queries here via Kibana Query Language (KQL)
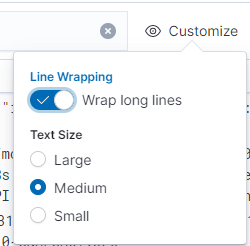
2. “Customize”. Some configuration for displaying logs (text size and wrapping long lines)
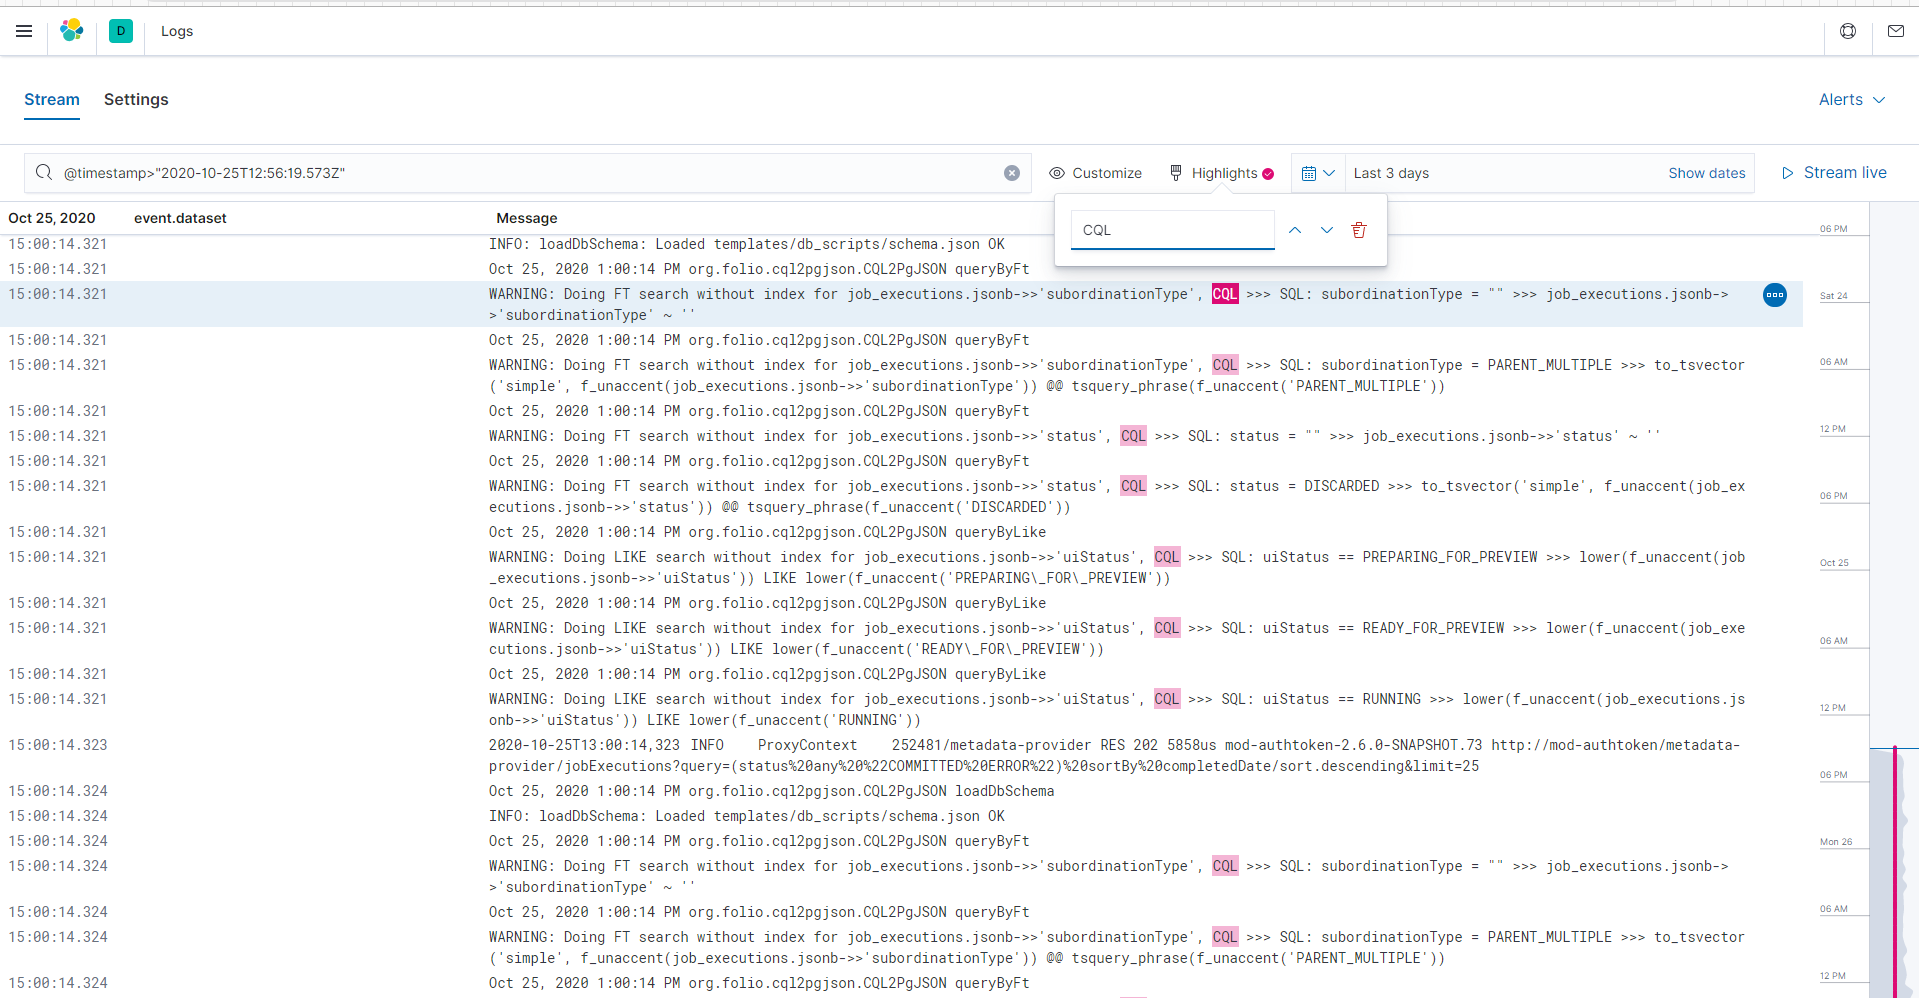
3. “Highlights”. The mechanism for highlighting specific keywords or phrases in resulting logs (these keywords/phrases will be painted in yellow color)
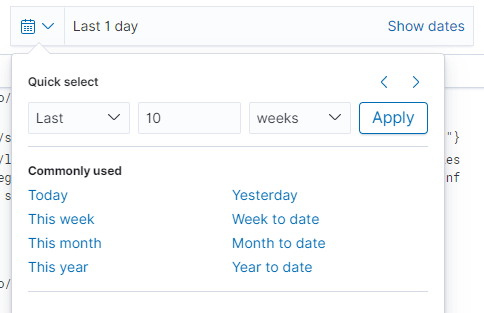
4. “Date tool”. A really useful tool for selecting specific dates/periods for resulting logs.
5. “Stream live”. Button which allows watching logs “online”
6. Logs window. This is the window where resulting logs will appear
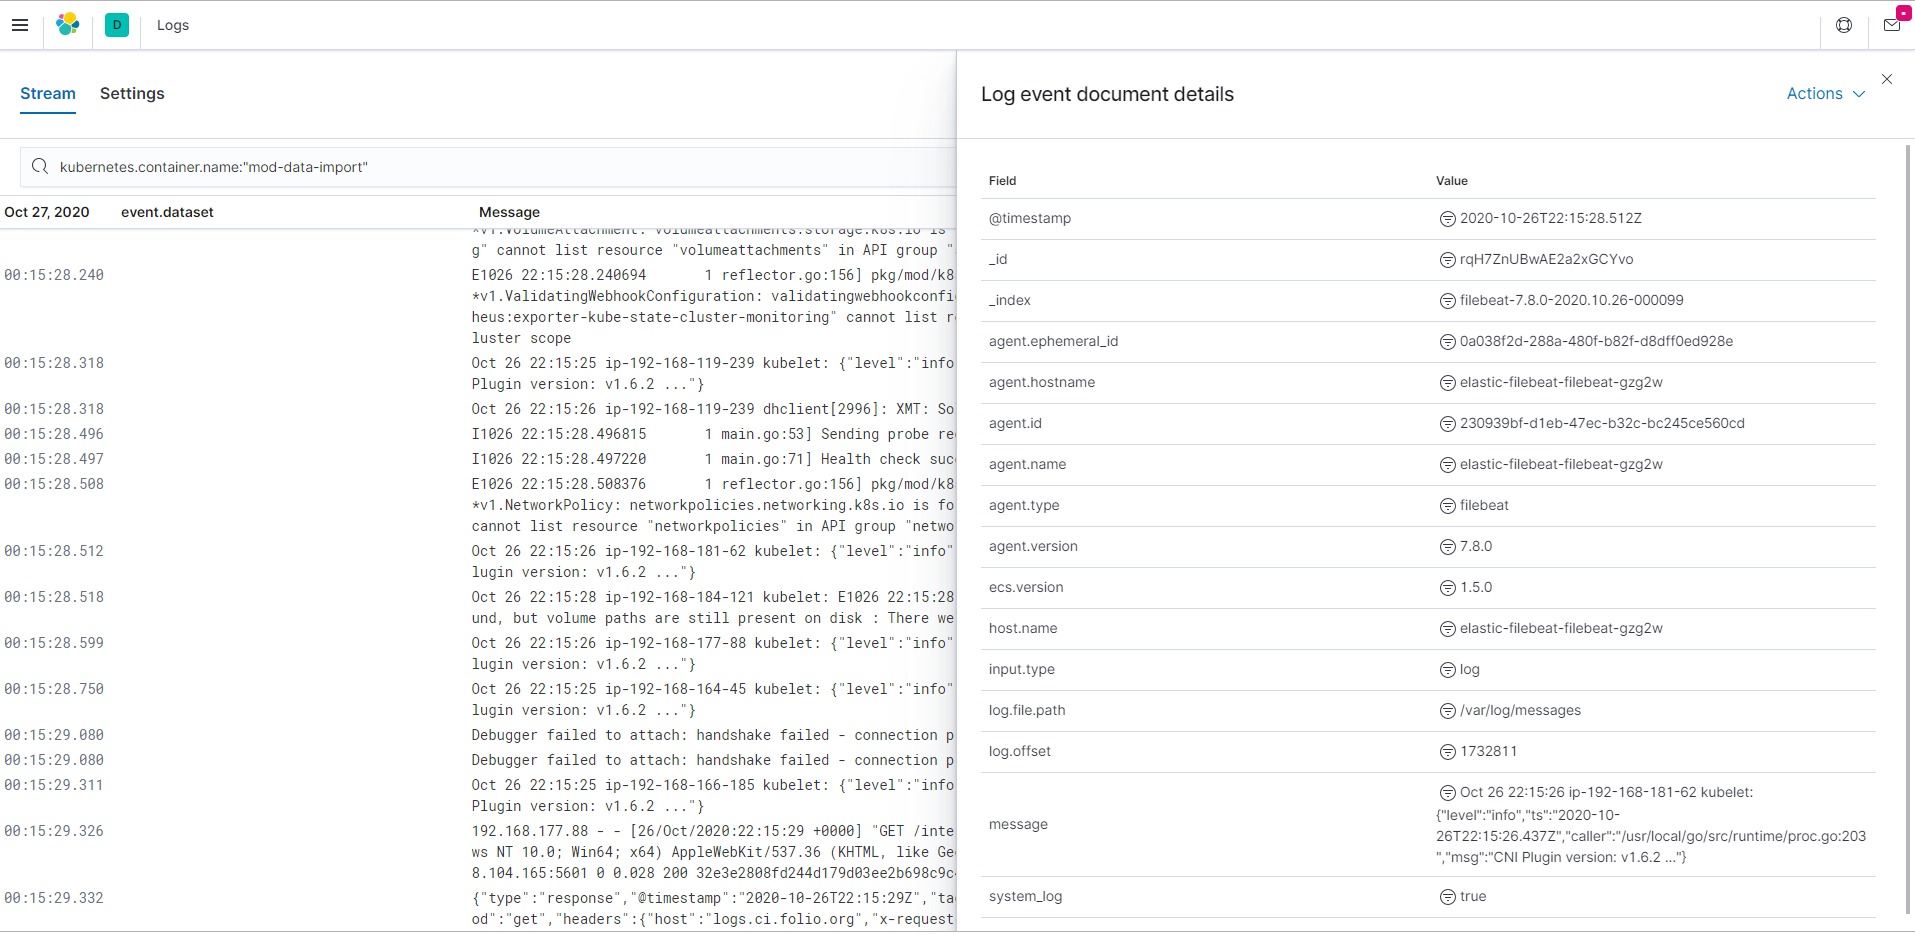
There is an ability to select specific row and select “View details” to show values for specific fields for this log-message (for example, “kubernetes.container.name” or “message”):
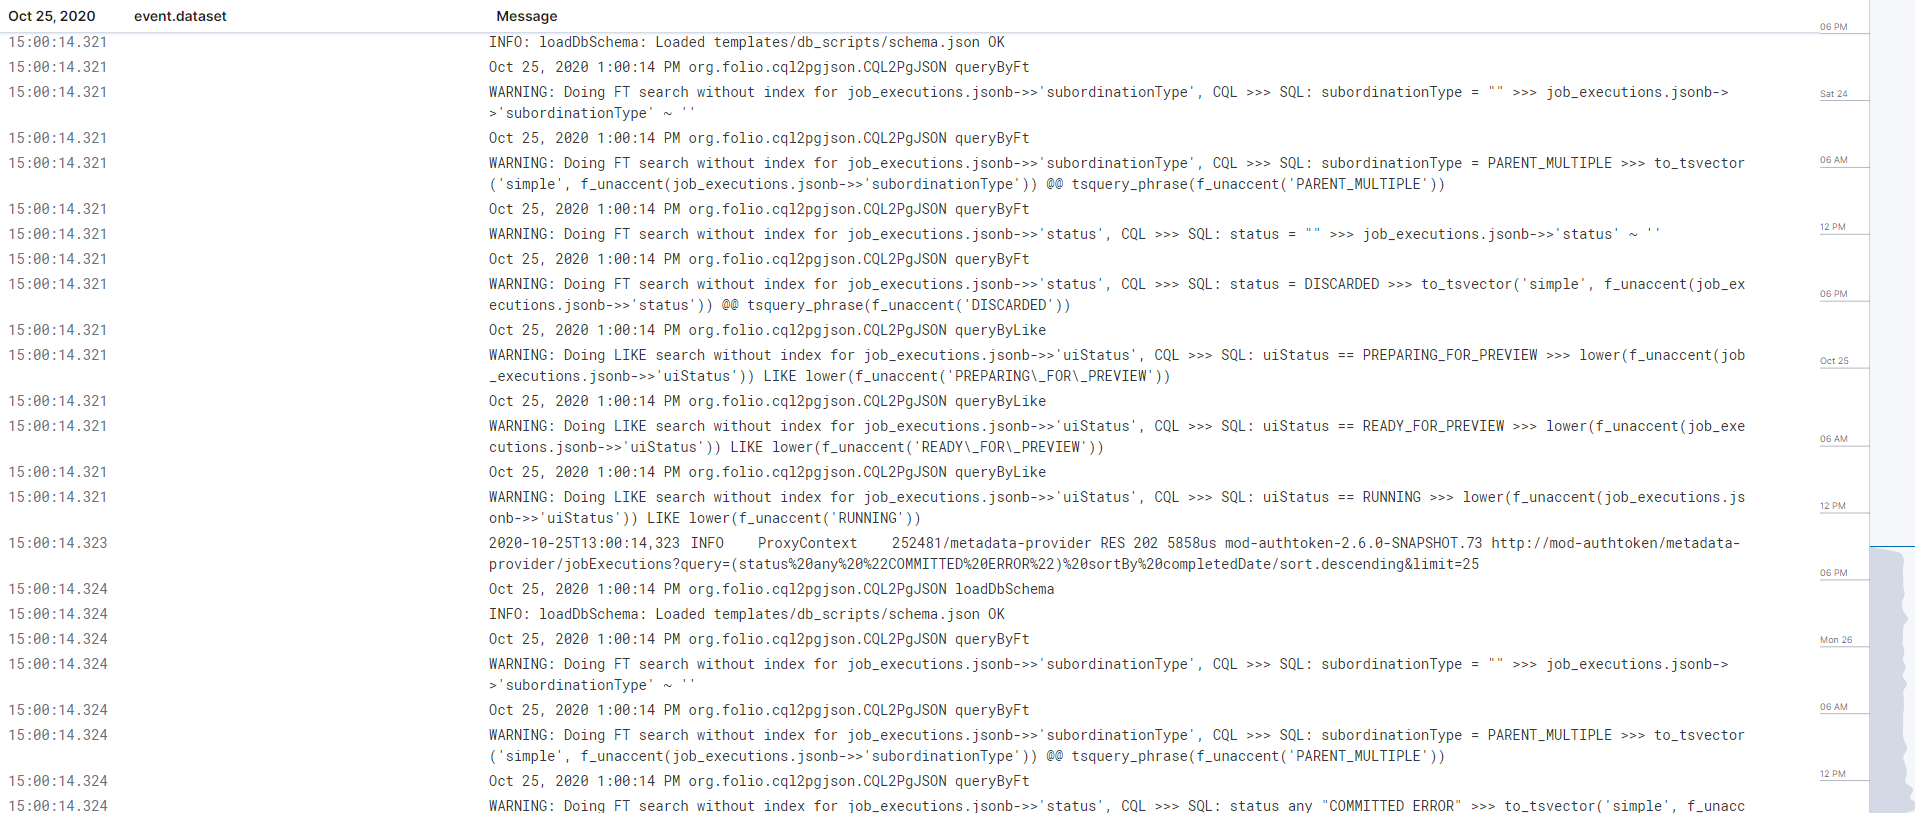
Moreover, there is a bar for showing the number of logs for a specific time in the right section of the page:
Kibana query language.
There is an ability to search for logs for specific fields and conditions.
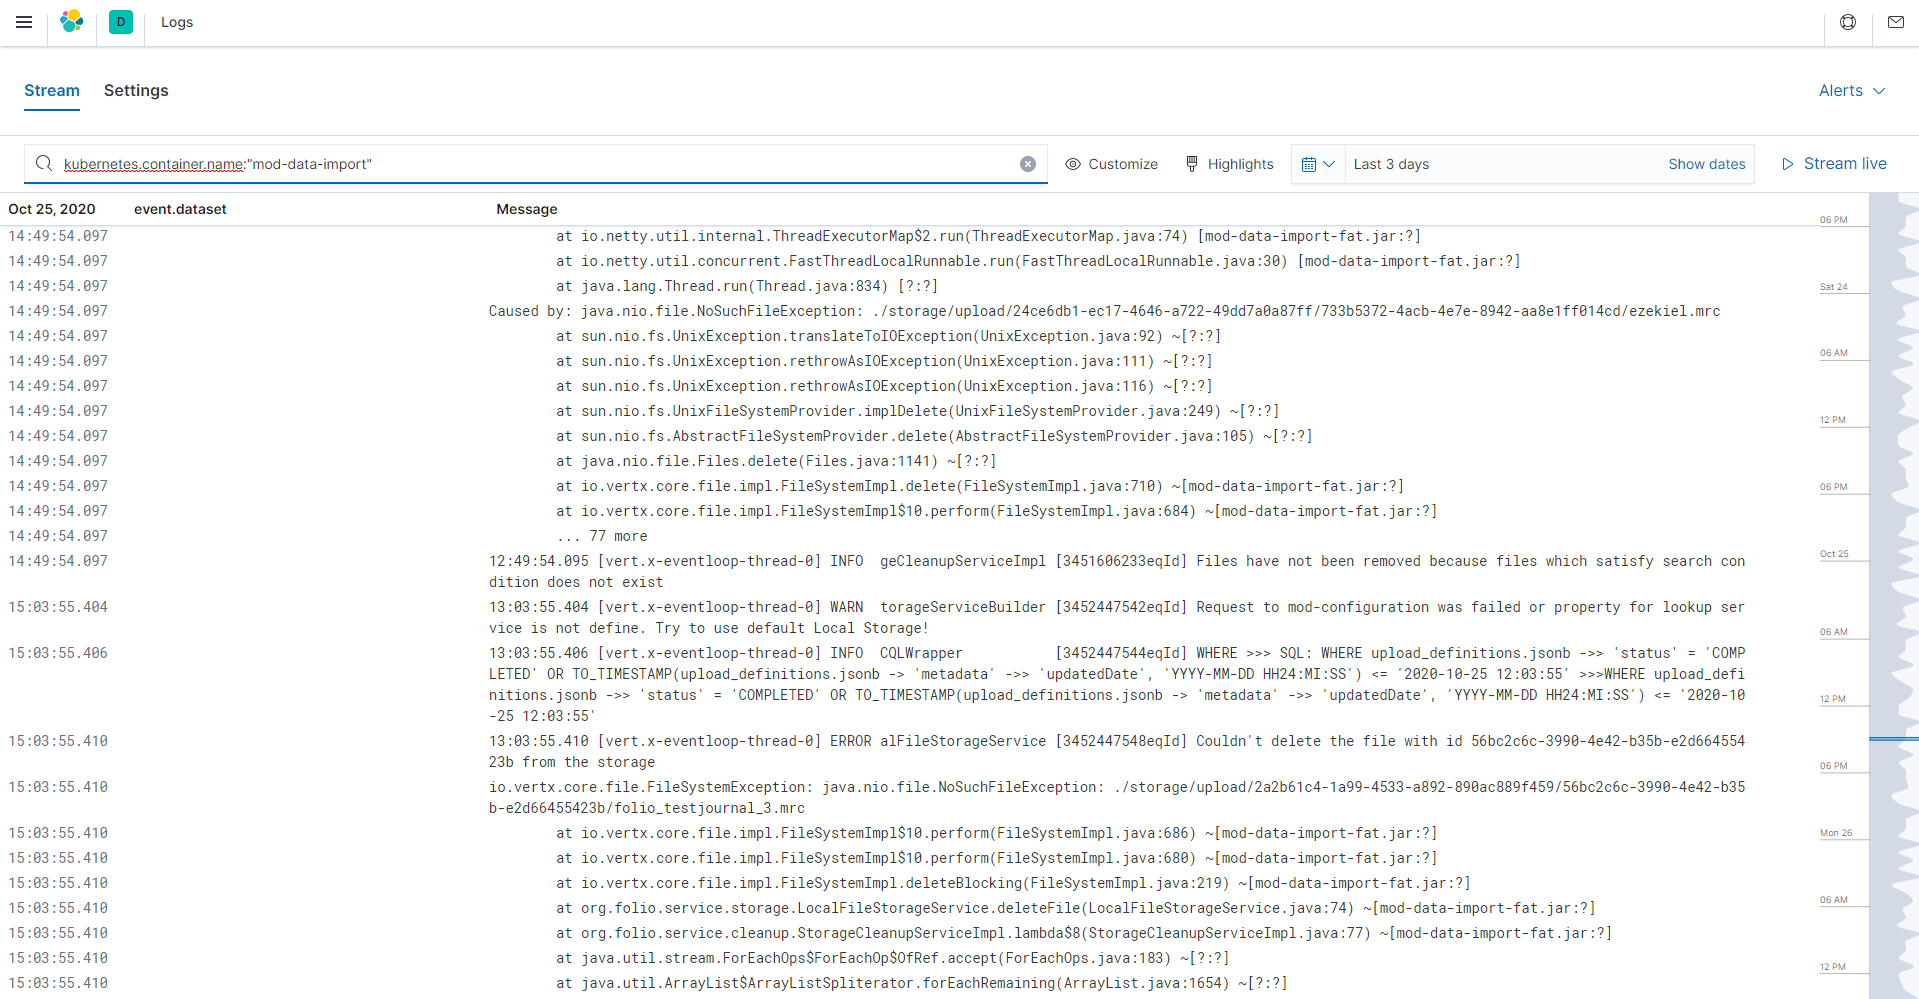
1. Searching logs from specific module (for example, “mod-data-import”): kubernetes.container.name:"mod-data-import"
“kubernetes.container.name” – is the field name. Simpler – module name.
Operator “:” – equals some value.
"mod-data-import" – module name. (in quotes! Because this is a phrase search. Not by single keyword).
Moreover, there can be used operator “ : * ” – exists in any form.
2. Searching logs from the specific module and specific date (for example, “mod-data-import” in time which is greater than 2020-10-25T13:15:12.826Z):
container.name:"mod-data-import" and @timestamp>"2020-10-25T13:15:12.826Z"
There is a keyword “and”. KQL supports or, and, and not. By default, and has higher precedence than or. To override the default precedence, group operators in parentheses.
3. Search logs from the specific module and ERROR word: kubernetes.container.name:"mod-data-import" and message:ERROR
In this case, only “ERROR” logs from “mod-data-import” are selected.
One more example of a complex search query for finding errors or exceptions in all our modules:
(kubernetes.container.name:"mod-source-record-storage" or kubernetes.container.name:"mod-data-import" or kubernetes.container.name:"data-import-converter-storage" or kubernetes.container.name:"mod-source-record-manager") and (message:*ERROR or message:*Exception)
Moreover, there were created saved queries for FOLIJET-team.
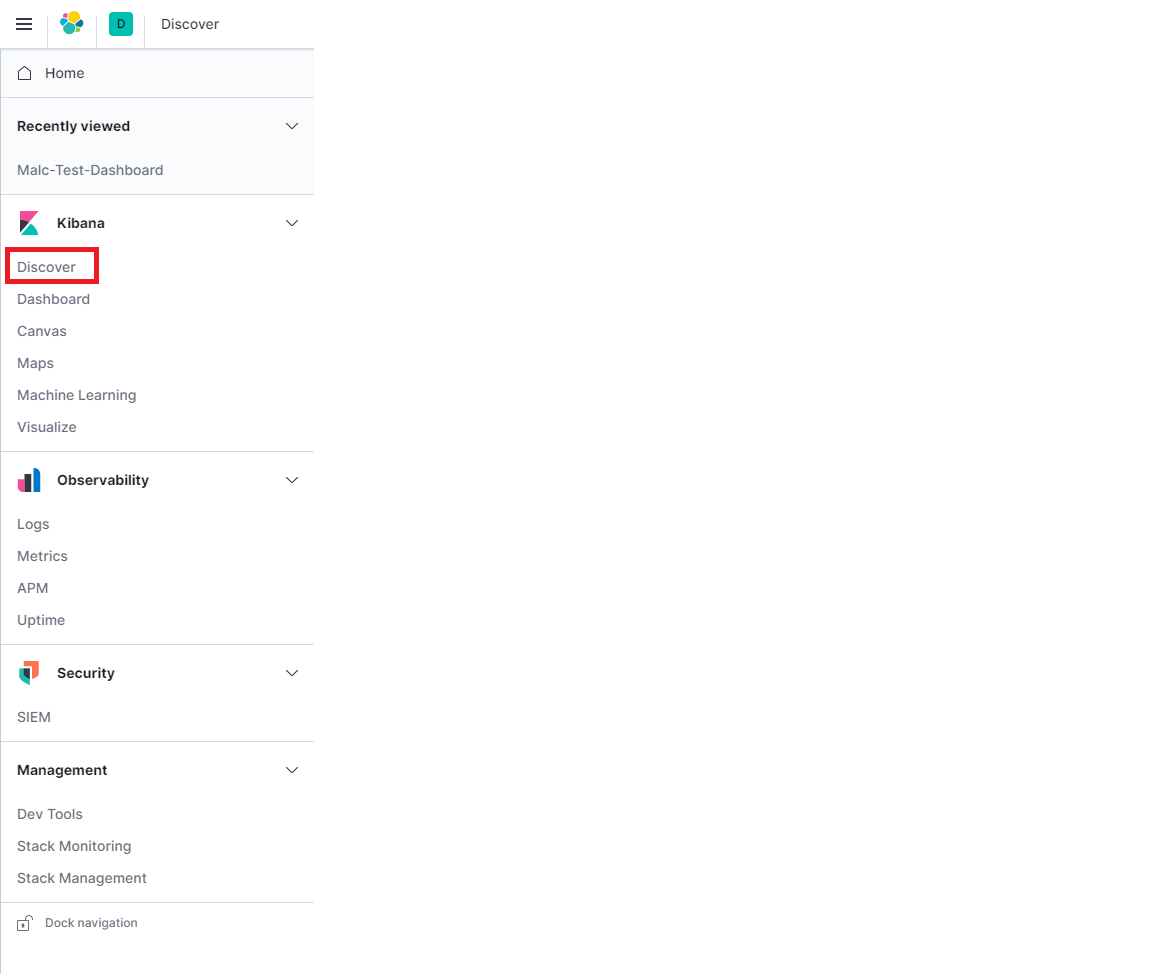
To use them, go to the https://logs.ci.folio.org/, and select "Kibana"→ "Discover":
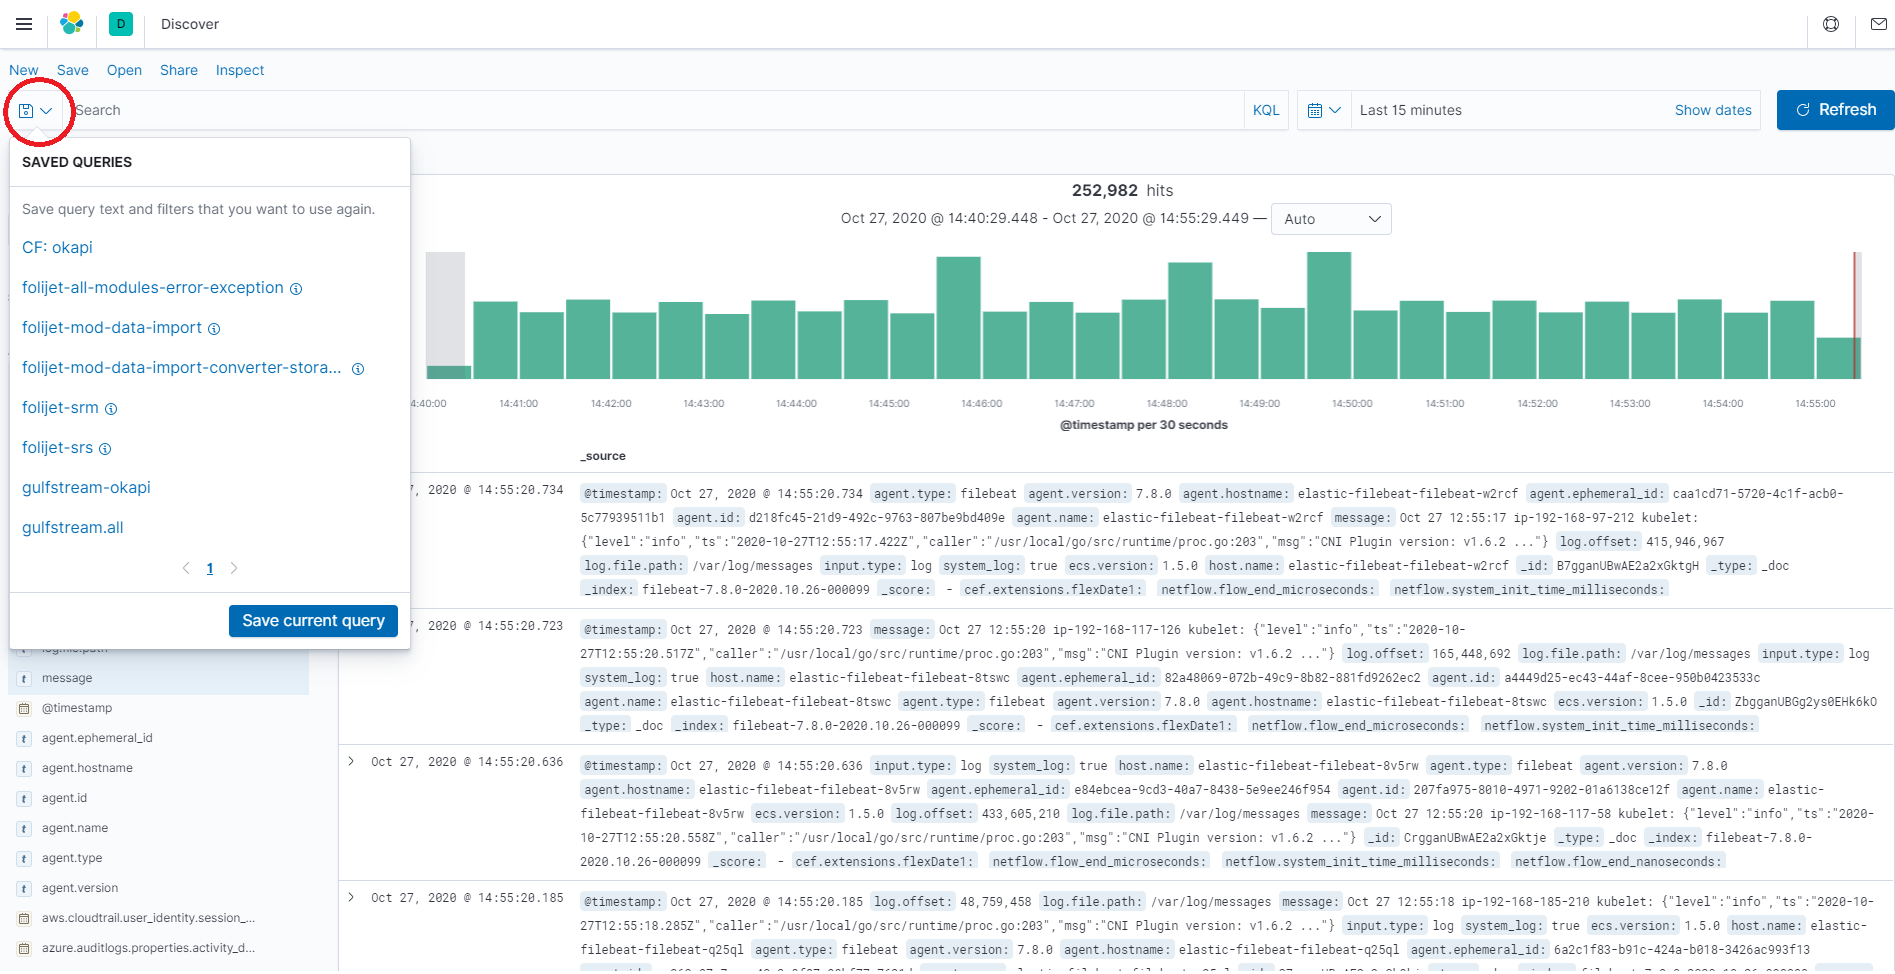
After that, click on the "Saved queries" button:
There are some already created and saved queries in pop-up. For FOIJET-team these queries have "folijet" prefix ("folijet-mod-data-import", ""folijet-mod-data-import-converter-storage", "folijet-srm", ""folijet-srs", "folijet-all-modules-error-exception").
For example, a query named "folijet-mod-data-import" searches all logs from "mod-data-import" module with namespace "folijet" and for the last 24 hours. The same for other our modules.
Moreover, was created "folijet-all-modules-error-exception" which searches logs with words "ERROR" or "EXCEPTION" for each of our modules for the last 24 hours.
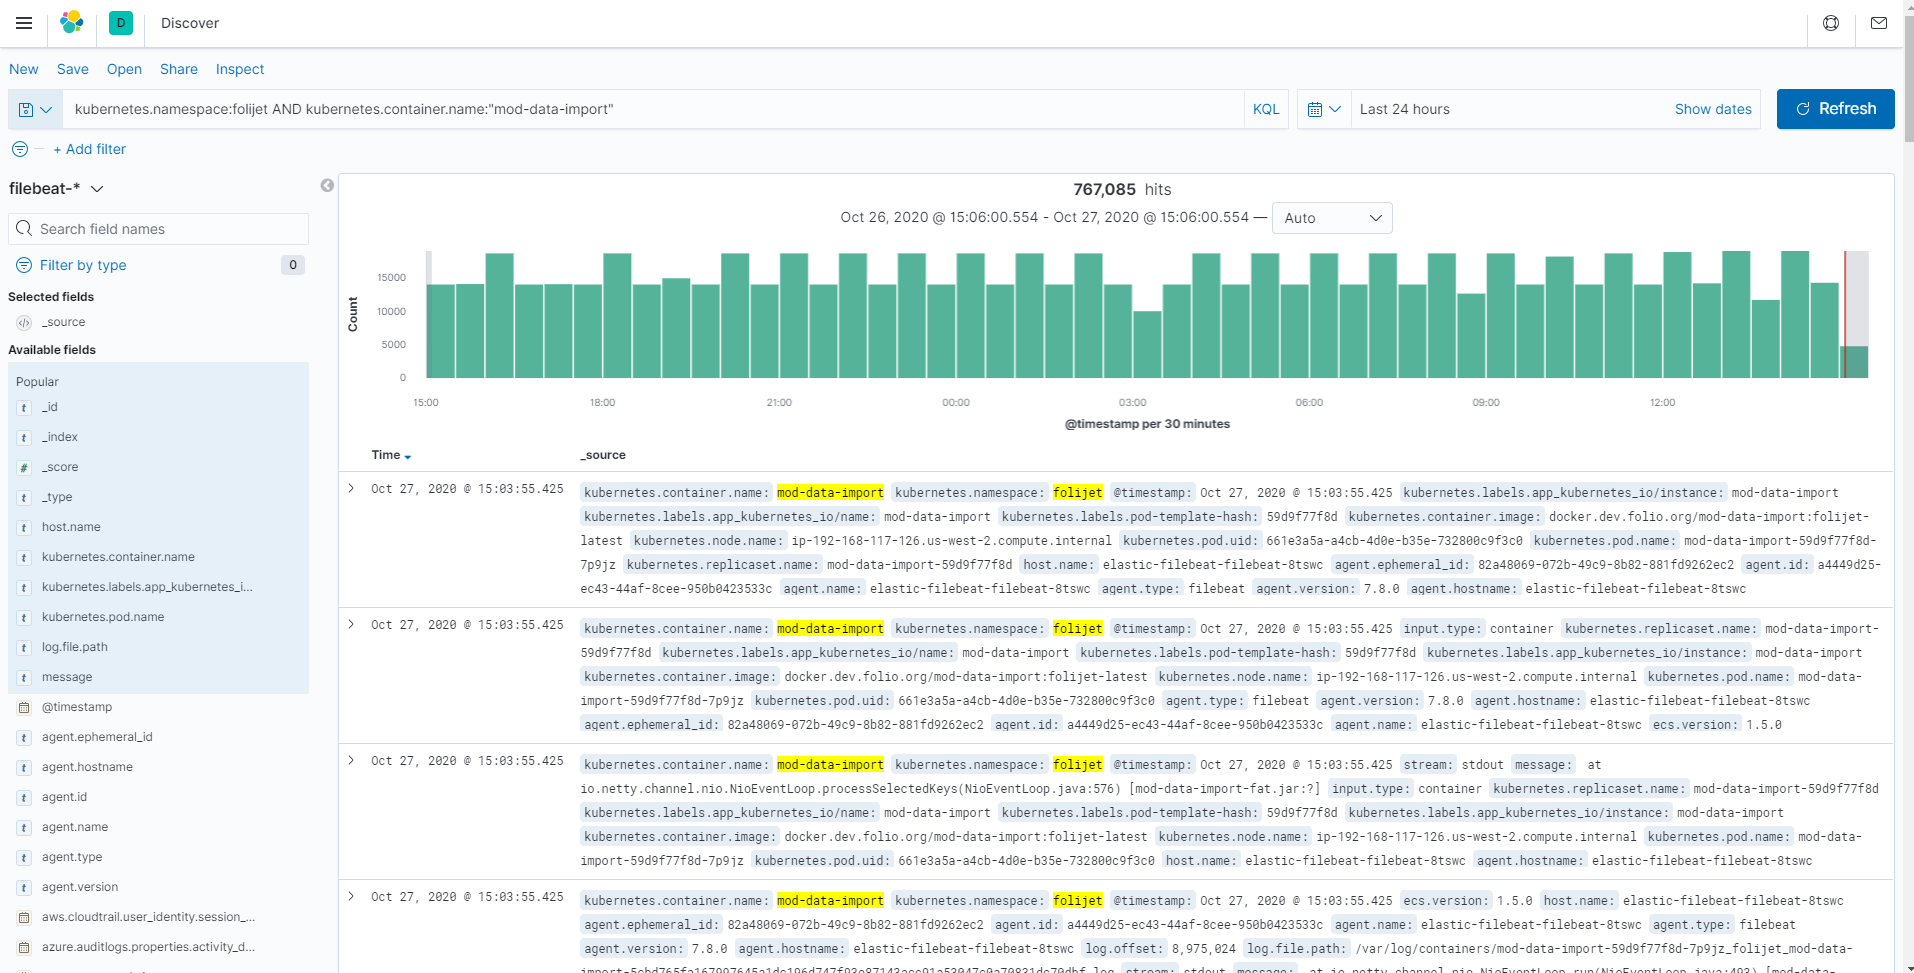
For using it just click on this query, and it will apply this query and retrieve logs for this condition:
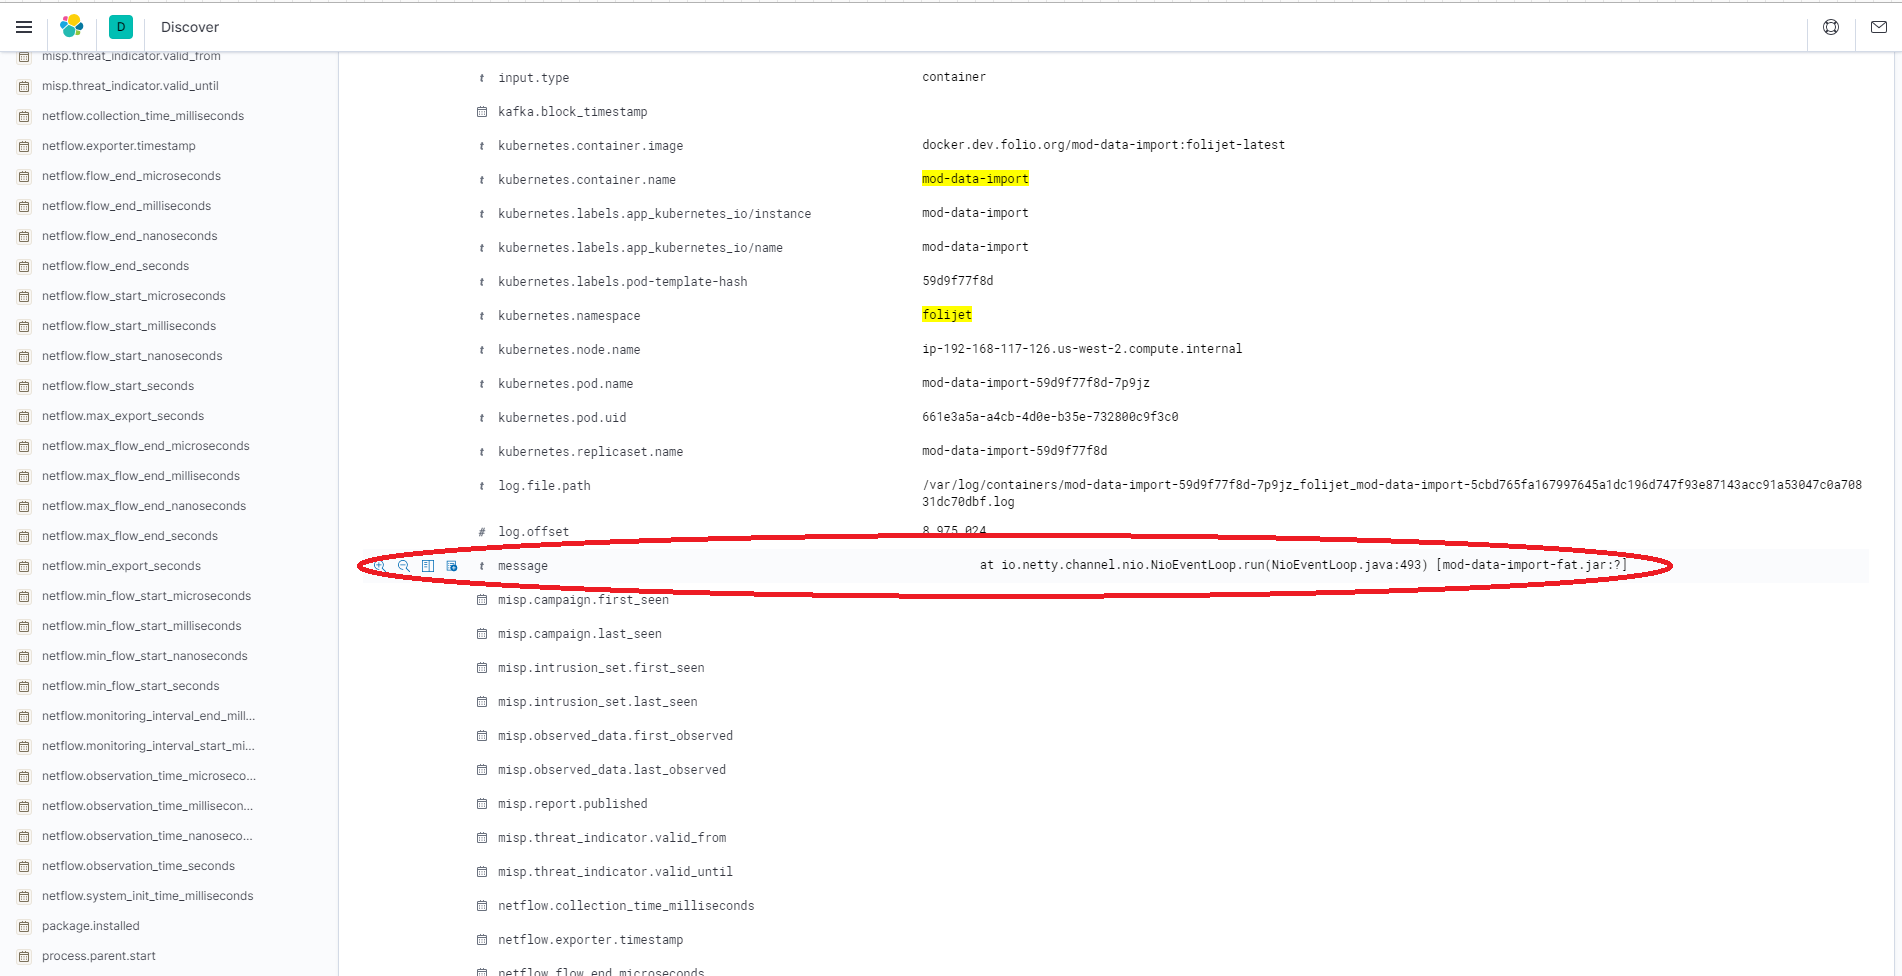
You can see logs for "folijet-mod-data-import" and "mod-data-import" were highlighted in these logs. To discover log-message just click on the specific log, and scroll down to the "message" field. This is log-message:
Note
Useful links:
- https://www.elastic.co/guide/en/observability/master/monitor-logs.html - Log monitoring description.
- https://www.elastic.co/guide/en/kibana/master/kuery-query.html - Kibana query language (KQL)
