PTF -RTAC Workflow Test Report (Fameflower)
PERF-61 - Getting issue details... STATUS
Overview
In this api, we are checking the performance of RTAC workflow running in the Fameflower release -
We tested it with 1, 5 virtual users for 30 minutes.
Backend:
- mod-circulation-18.0.9
- mod-circulation-storage-11.0.0
- mod-inventory-storage-19.1.2
- mod-inventory-14.1.3
- okapi-2.38.0
- mod-authtoken-2.4.0
- mod-permissions-5.9.0
Environment:
- 55 back-end modules deployed in 110 ECS services
- 3 okapi ECS services
- 8 m5.large EC2 instances
- 1 db.r5.xlarge AWS RDS instance
- INFO logging level
High Level Summary
- On average rtac/${instanceId} API call takes ~13 seconds for an instance which has greater than 300 holdings
- The main issue is with https://github.com/folio-org/mod-rtac/blob/d8e51a8a82b69a6f1717b9c7abf60342ded99246/src/main/java/org/folio/rest/impl/RtacResourceImpl.java#L48. Most of the wait time is due to lots and lots of API calls to get holdings, items, and loans. Even after leveraging vertx's asynchronous behavior and considering the fact that 1 instance -> many holdings -> each holding -> many items -> each item -> many loans, this call chain triggers O(n^3) algorithmic complexity.
see Recommended Improvements for the JIRAs that were created/covered by this testing effort.
Test Runs
Test | Virtual Users | Duration | OKAPI log level | Profiled | Holdings per instance | API call |
1. | 1 | 30 min | WARNING | No | greater than 300 | GET rtac/${instanceId} |
2. | 5 | 30 min | WARNING | No | greater than 300 | GET rtac/${instanceId} |
| 3. | 1 | 30 min | WARNING | Off | greater than 300 | Mimic above call: GET inventory/instances/${instanceId} → GET /holdings-storage/holdings → GET /inventory/items → GET /circulation/loans |
| 4. | 5 | 30 min | WARNING | Off | greater than 300 | Mimic above call: GET inventory/instances/${instanceId} → GET /holdings-storage/holdings → GET /inventory/items → GET /circulation/loans |
Results
- A rtac-level request to get all open loans for greater than 300 holdings per instance
GET rtac/${instanceId}
For 30 minutes Profiler Average 75th %tile 1 user ON 17.62 seconds 25.47 seconds 1 user OFF 15.44 seconds 20.99 seconds 5 users ON 47.53 seconds 55.01 seconds 5 users OFF 42.06 seconds 49.61 seconds Because there are no custom metrics inside mod-rtac to expose the wait time of each API call, we needed to mimic the rtac API logic by making subsequent calls to mod-inventory, mod-circulation to get open loans for greater than 300 holdings per instance in the JMeter script. One caveat is that these calls are synchronous and are end-to-end (over the internet from JMeter to FOLIO) so naturally these API calls will be slower compared to the actual /rtac API calls from mod-rtac which were implemented asynchronously. Therefore, the response times while are not likely what is seen by the code but should still give us a good idea of the cost of making n^3 API calls even if we take off some percentage for end-to-end over-the-wire latencies.
Calculations:
Total response time to get all holdings, items, open loans per instance(seconds) = time to get current instance + time to get all holdings
time to get all holdings = get all holdings per instance + time to get all items + time to get all loans
time to get all items = get current_item * total items
time to get all loans = get current_loan * total loans
Get an instance
GET inventory/instances/${instanceId}| Profiler | current_instance + avg(get all holdings) = Total average | current_instance + avg(get all holdings) = Total average 75th %tile | |
| 1 user | ON | 143 ms + 54.5 sec = 54.7 sec | 131 ms + 54.7 sec = 54.9 sec |
| 1 user | OFF | 118 ms + 48.4 sec = 48.6 sec | 108 ms + 52.6 sec = 52.7 sec |
| 5 users | ON | 129 ms + 67.2 sec = 67.3 sec | 137 ms + 70.1 sec = 70.2 sec |
| 5 users | OFF | 102 ms + 57.8 sec = 57.9 sec | 112 ms + 58.2 sec = 58.3 sec |
For each instance, get all holdings
GET /holdings-storage/holdings?limit=2147483647&query=instanceId==${instanceId}| Profiler | avg(get all holdings per instance) + avg(get all items) + avg(get all loans) = Total average | avg(get all holdings per instance) + avg(get all items) + avg(get all loans) = Total average 75th %tile | |
| 1 user | ON | 174 ms + 39 sec + 15.3 sec = 54.5 sec | 213 ms + 40.2 sec + 14.3 sec = 54.7 sec |
| 1 user | OFF | 73 ms + 34 sec + 14.3 sec = 48.4 sec | 86 ms + 40.2 sec + 12.3 sec = 52.6 sec |
| 5 users | ON | 179 ms + 49.3 sec + 17.7 sec = 67.2 sec | 223 ms + 51.6 sec + 18 sec = 70.1 sec |
| 5 users | OFF | 71 ms + 42.9 sec + 14.9 sec = 57.8 | 40 ms + 42.6 sec + 15.6 sec = 58.2 sec |
For each holding, get all items
GET /inventory/items?limit=2147483647&query=holdingsRecordId==${current_holding}| Profiler | avg(get current_item) * total items = Total average | avg(get current_item) * total items = Total average 75th %tile | |
| 1 user | ON | 119 ms * 333 = 39 sec | 121 ms * 333 = 40.2 sec |
| 1 user | OFF | 104 ms * 333 = 34 sec | 106 ms * 333 = 35.2 sec |
| 5 users | ON | 148 ms * 333 = 49.3 sec | 155 ms * 333 = 51.6 sec |
| 5 users | OFF | 129 ms * 333 = 42.9 sec | 128 ms * 333 = 42.6 sec |
For each item, get all open loans
GET /circulation/loans?limit=2147483647&query=(itemId==${current_item} and status.name==Open)| Profiler | avg(get current_loan) * total loans = Total average | avg(get current_loan) * total loans = Total average 75th %tile | |
| 1 user | ON | 46 ms * 333 = 15.3 sec | 43 ms * 333 = 14.3 sec |
| 1 user | OFF | 43 ms * 333 = 14.3 sec | 37 ms * 333 = 12.3 sec |
| 5 users | ON | 53 ms * 333 = 17.7 sec | 54 ms * 333 = 18 sec |
| 5 users | OFF | 45 ms * 333 = 14.9 sec | 47 ms * 333 = 15.6 sec |
JVM Profiling
- Overall slow methods (between the modules profiled: mod-rtac, mod-circulation, mod-circulation-storage, mod-inventory, mod-inventory-storage)
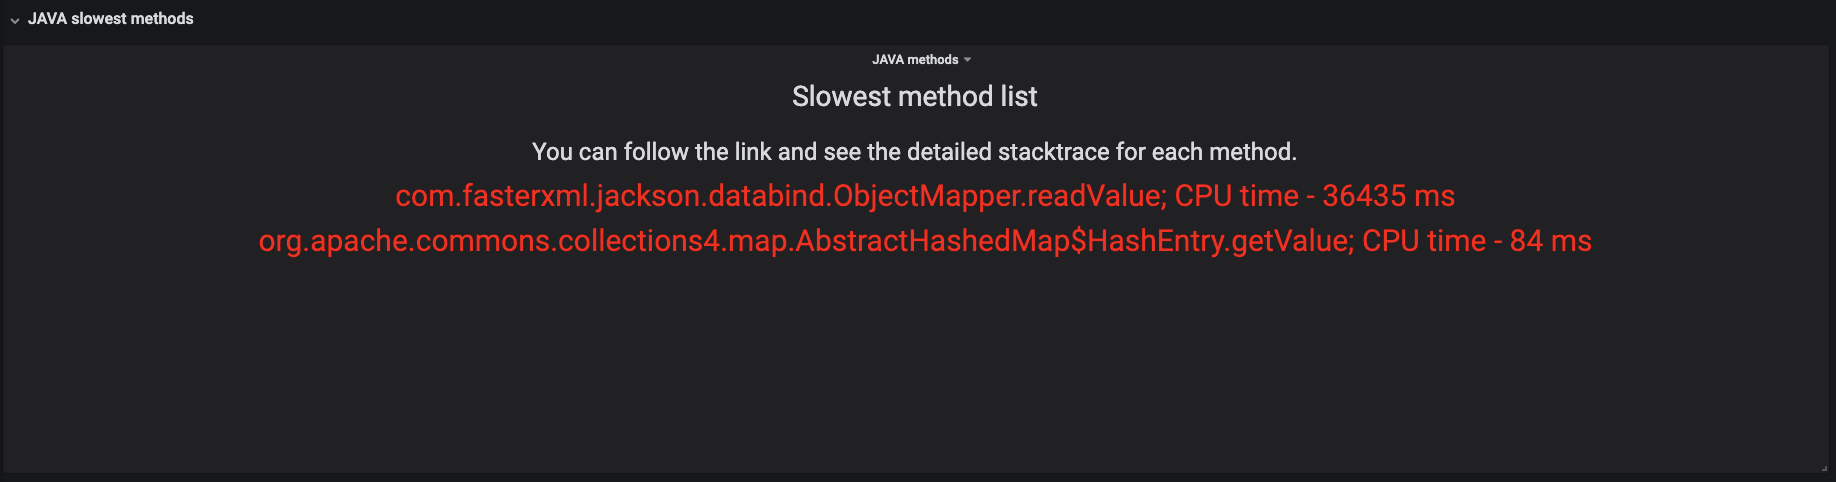
To see more drill down these methods at: http://ec2-54-165-58-65.compute-1.amazonaws.com/grafana/d/b3iP-8hiz/java-profiling-folio-new?orgId=1&from=1592598484852&to=1592600441623&var-service_tag=mod-rtac&var-aggregation=10s
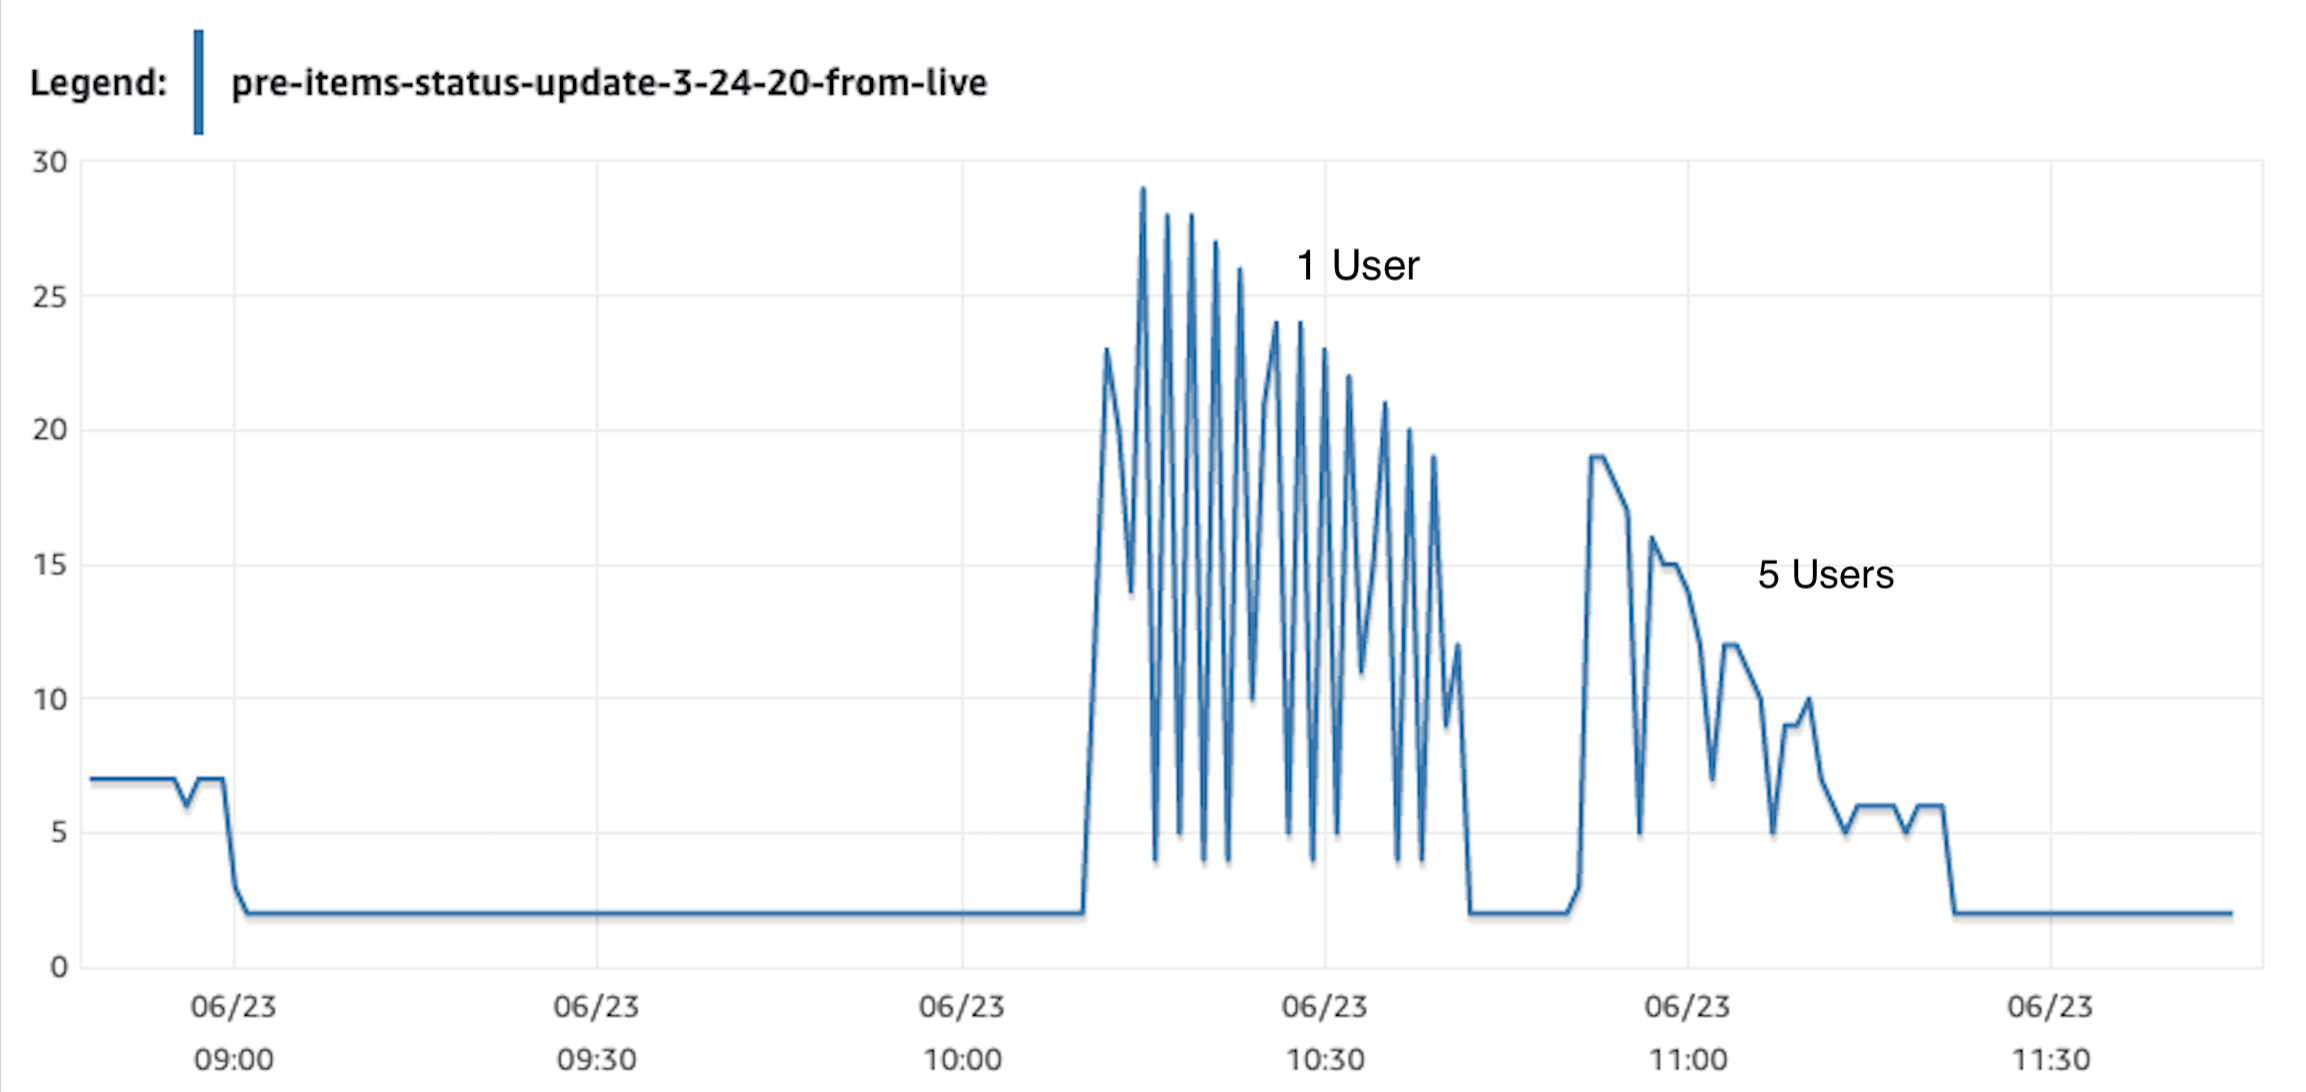
Database
The database CPU usage decreases slightly as the number of users increases 1, 5 users run. At maximum 28% CPU usage for 1 user. We are seeing a slight decrease in CPU utilization for 5 Users because RDS Postgresql is caching the most frequent query results.
Database Slow queries
The slowest query which took the most of execution time was initiated by the mod_inventory_storage service presented in the following table:
Percent of total time | Average Time, ms | Calls | Module | Query |
|---|---|---|---|---|
| 77% | 14,632 ms | 21 | mod_inventory_storage | SELECT COUNT(*) FROM fs09000000_mod_inventory_storage.holdings_record |
API response time vs Postgresql query response time
This difference below between API and Postgresql query response time is the sum of network time to/back from calling database, deserialization of JSON string into JSON objects, processing time, and network time to/from API. Below are a single API request and SQL query triggered manually for comparison.
| Action | Type of Request | Actual request | Time, ms |
|---|---|---|---|
| get Instance | SQL query | select * from fs09000000_mod_inventory_storage.instance where id = '00009a0b-e973-443b-9796-c3373a352f86'; | 305 |
| API request | https:/{okapi-url}/inventory/instances/00009a0b-e973-443b-9796-c3373a352f86 | 368 | |
| get holdings | SQL query | select * from fs09000000_mod_inventory_storage.holdings_record hr1 where hr1.instanceid = '121063ba-43cc-48f4-a49f-aaf5488127e0'; | 350 |
| API request | https:/{okapi-url}/holdings-storage/holdings?limit=2147483647&query=instanceId==121063ba-43cc-48f4-a49f-aaf5488127e | 503 | |
| get Item | SQL query | select * from fs09000000_mod_inventory_storage.item where holdingsrecordid='95a897e5-2505-4803-a7f1-7da39c9f67cb'; | 353 |
| API request | https://{okapi-url}/inventory/items?limit=2147483647&query=holdingsRecordId%3D%3D95a897e5-2505-4803-a7f1-7da39c9f67cb | 662 | |
| get Open loan | SQL query | select * from fs09000000_mod_circulation_storage.loan where jsonb->>'itemId'='3faad467-fca1-41c8-ad7d-af1dcd3fdc3c' AND jsonb->'status'->>'name'='Open'; | 372 |
| API request | https://{okapi-url}/circulation/loans?limit=2147483647&query=(itemId==3faad467-fca1-41c8-ad7d-af1dcd3fdc3c and status.name==Open) | 400 |
CPU Utilization
CPU utilization is relatively on a lower side for most modules except for mod-inventory-storage
| 1 user | 5 users | |
|---|---|---|
| Average % | Average % | |
| mod-circulation | 3.14 | 3.95 |
| mod-circulation-storage | 4.84 | 6.38 |
| mod-inventory | 5.38 | 6.54 |
| mod-inventory-storage | 26 | 24 |
| mod-rtac | 2.45 | 3 |
Memory
Memory was stable throughout the runs, only a spike here or there, but in a 30 minutes run they were consistent.
| 1 user | 5 users | |
|---|---|---|
| Average % | Average % | |
| mod-circulation | 72.1 | 72.50 |
| mod-circulation-storage | 39.46 | 39.55 |
| mod-inventory | 44 | 46.5 |
| mod-inventory-storage | 44.30 | 45 |
| mod-rtac | 55.2 | 55 |
Recommended Improvements
- The following JIRA has been created for mod-rtac:
MODRTAC-38 - Getting issue details... STATUS
- Consider taking advantage of CQL "OR" operator to chain IDs together at each level of getting items, holdings, loans, instead of making API calls. This approach could be faster, although need to be proven.
- Consider doing SQL joins between instance/holdings/items where possible to reduce making API and database calls.
- In mod-circulation, mod-circulation-storage, mod-inventory-storage, consider using a more efficient JSON package or call using the existing Jackson serialization calls in a different way to address the item: JVM profiling shows JSON de/serialization operations one of the slowest operations.
Appendix
See Attached rtac-test-report.xlsx for details