Problem statement
There should be platform wide solution for logging aggregation in order to quickly identify and find the root causes of issues
...
In order to include request information RMB based modules will be able to leverage FolioLoggingContext after implementation of
| Jira Legacy | ||||||
|---|---|---|---|---|---|---|
|
...
When user request routed to multiple, different microservices and something goes wrong and a request fails, this request-id that will be included with every log message and allow request tracking.
Usage of Log4j 2 Layouts
An Appender in Log4j 2 uses a Layout to format a LogEvent into a form that meets the needs of whatever will be consuming the log event. The library provides a complete set of possible Layout implementations. It is recommended to use either Pattern or JSON layouts in FOLIO backend modules. By default, the Pattern layout should be used for development, testing, and production environments. In the cases when log aggregators are used in particular environments, the usage of JSON layout should be enabled explicitly for all backend modules by the support/deployment teams.
All FOLIO backend modules must provide configuration property files for both layouts (Pattern and JSON). In addition, recommended default logging configurations are provided by the respective libraries (folio-spring-base, RMB).
...
For any logging aggregation solution json format of logs is preferable over plain text in terms of performance and simplicity of parsing. All Folio modules should have the same json format for logs, e.g. the following:
httpsFor Spring Way modules https://github.com/folio-org/folio-spring-base/blob/master/src/main/resources/log4j2-json.properties
For RMB modules https://github.com/folio-org/raml-module-builder/blob/master/domain-models-runtime/src/main/resources/log4j2-json.properties
Default configuration for Pattern Layout
httpsFor Spring Way modules https://github.com/folio-org/folio-spring-base/blob/master/src/main/resources/log4j2.properties
For RMB modules https://github.com/folio-org/raml-module-builder/blob/master/domain-models-runtime/src/main/resources/log4j2.properties
Logging aggregation stack
...
| Expand |
|---|
EFKThe goal of centralized logging stack is quickly sort through and analyze the heavy volume of logs. On of the most popular centralized logging solution is the Elasticsearch, Fluentd, and Kibana (EFK) stack. Pros:
Cons:
Elasticsearch is a real-time, distributed, and scalable search engine which allows for full-text and structured search, as well as analytics. It is commonly used to index and search through large volumes of log data, but can also be used to search many different kinds of documents. Elasticsearch is commonly deployed alongside Kibana, a powerful data visualization frontend and dashboard for Elasticsearch. Kibana allows you to explore your Elasticsearch log data through a web interface, and build dashboards and queries to quickly answer questions. Fluentd will be used to collect, transform, and ship log data to the Elasticsearch backend. Fluentd is a popular open-source data collector that we’ll set up on our Kubernetes nodes to tail container system out (or log files), filter and transform the log data, and deliver it to the Elasticsearch cluster, where it will be indexed and stored. AlertingThere are many plugins available for watching and alerting on Elasticsearch index in Kibana e.g. X-Pack, SentiNL, ElastAlert. Alerting can be easily implemented in Kibana (see: https://www.elastic.co/blog/creating-a-threshold-alert-in-elasticsearch-is-simpler-than-ever) Elastalert is open source simple and popular open source tool for alerting on anomalies, spikes, or other patterns of interest found in data stored in Elasticsearch. Elastalert works with all versions of Elasticsearch. Deployment optionsK8s deployment
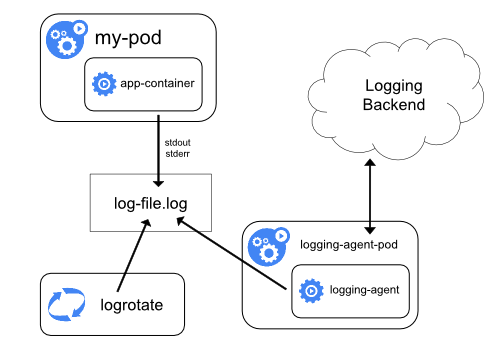
Separate Pods should be deployed to avoid the “split-brain” issue (see A new era for cluster coordination in Elasticsearch and Voting configurations). K8s deployment: KibanaTo launch Kibana on Kubernetes Service called kibana should be created in the K8s deployment: FluentdFluentd should be deployed as a DaemonSet, which is a Kubernetes workload type that runs a copy of a given Pod on each node in the Kubernetes cluster (see: https://kubernetes.io/docs/concepts/cluster-administration/logging/#using-a-node-logging-agent). Folio modules should use single common slf4j configuration, for writing JSON logs on the nodes. The Fluentd Pod will tail these logs, filter log events, transform the log data, and ship it off to the Elasticsearch. Fluentd DaemonSet spec provided by the Fluentd maintainers should be used along with docs provided by the Fluentd maintainers: Kuberentes Fluentd. Service Account called NoSchedule toleration should be defined to match the equivalent taint on Kubernetes master nodes. This will ensure that the DaemonSet also gets rolled out to the Kubernetes masters (see: https://kubernetes.io/docs/concepts/configuration/taint-and-toleration/). https://hub.docker.com/r/fluent/fluentd-kubernetes-daemonset/ provided by the Fluentd maintainers should be used. This Dockerfile and contents of this image are available in Fluentd’s fluentd-kubernetes-daemonset Github repo. The following environment variables should be configured for Fluentd:
|
...