Requirements: MODINVOICE-101 - Getting issue details... STATUS , MODORDERS-311 - Getting issue details... STATUS , MODORGS-45 - Getting issue details... STATUS
Memory issues detection approach
Throttled mode of service load is most convenient way to identify memory leaks or another memory utilization issues. The utility https://github.com/khandramai/gatling-folio-performance for emulation of load regime was implemented based on load and performance testing framework Gatling.
In scope of this investigation cyclic CRUD operations in 25 threads during 4 hours was used as base load. Monitoring of service operating was carried out with using the VisualVM profiler.
Deep analysis of the memory utilization was performed with using Eclipse Memory Analyzer on the basis of memory dumps prepared in advance during the operation of the service (after 1 hour of service operating).
Issues Found
JMX reporting based on Dropwizard metrics
Description
The heap memory size is constantly increasing under load, reaches the maximum value for the container and a service failure occurs. The service does not recover after a load disconnect.
Detailed investigation
Emulation of the load on local equipment showed the following results.
CPU/Heap utilization:
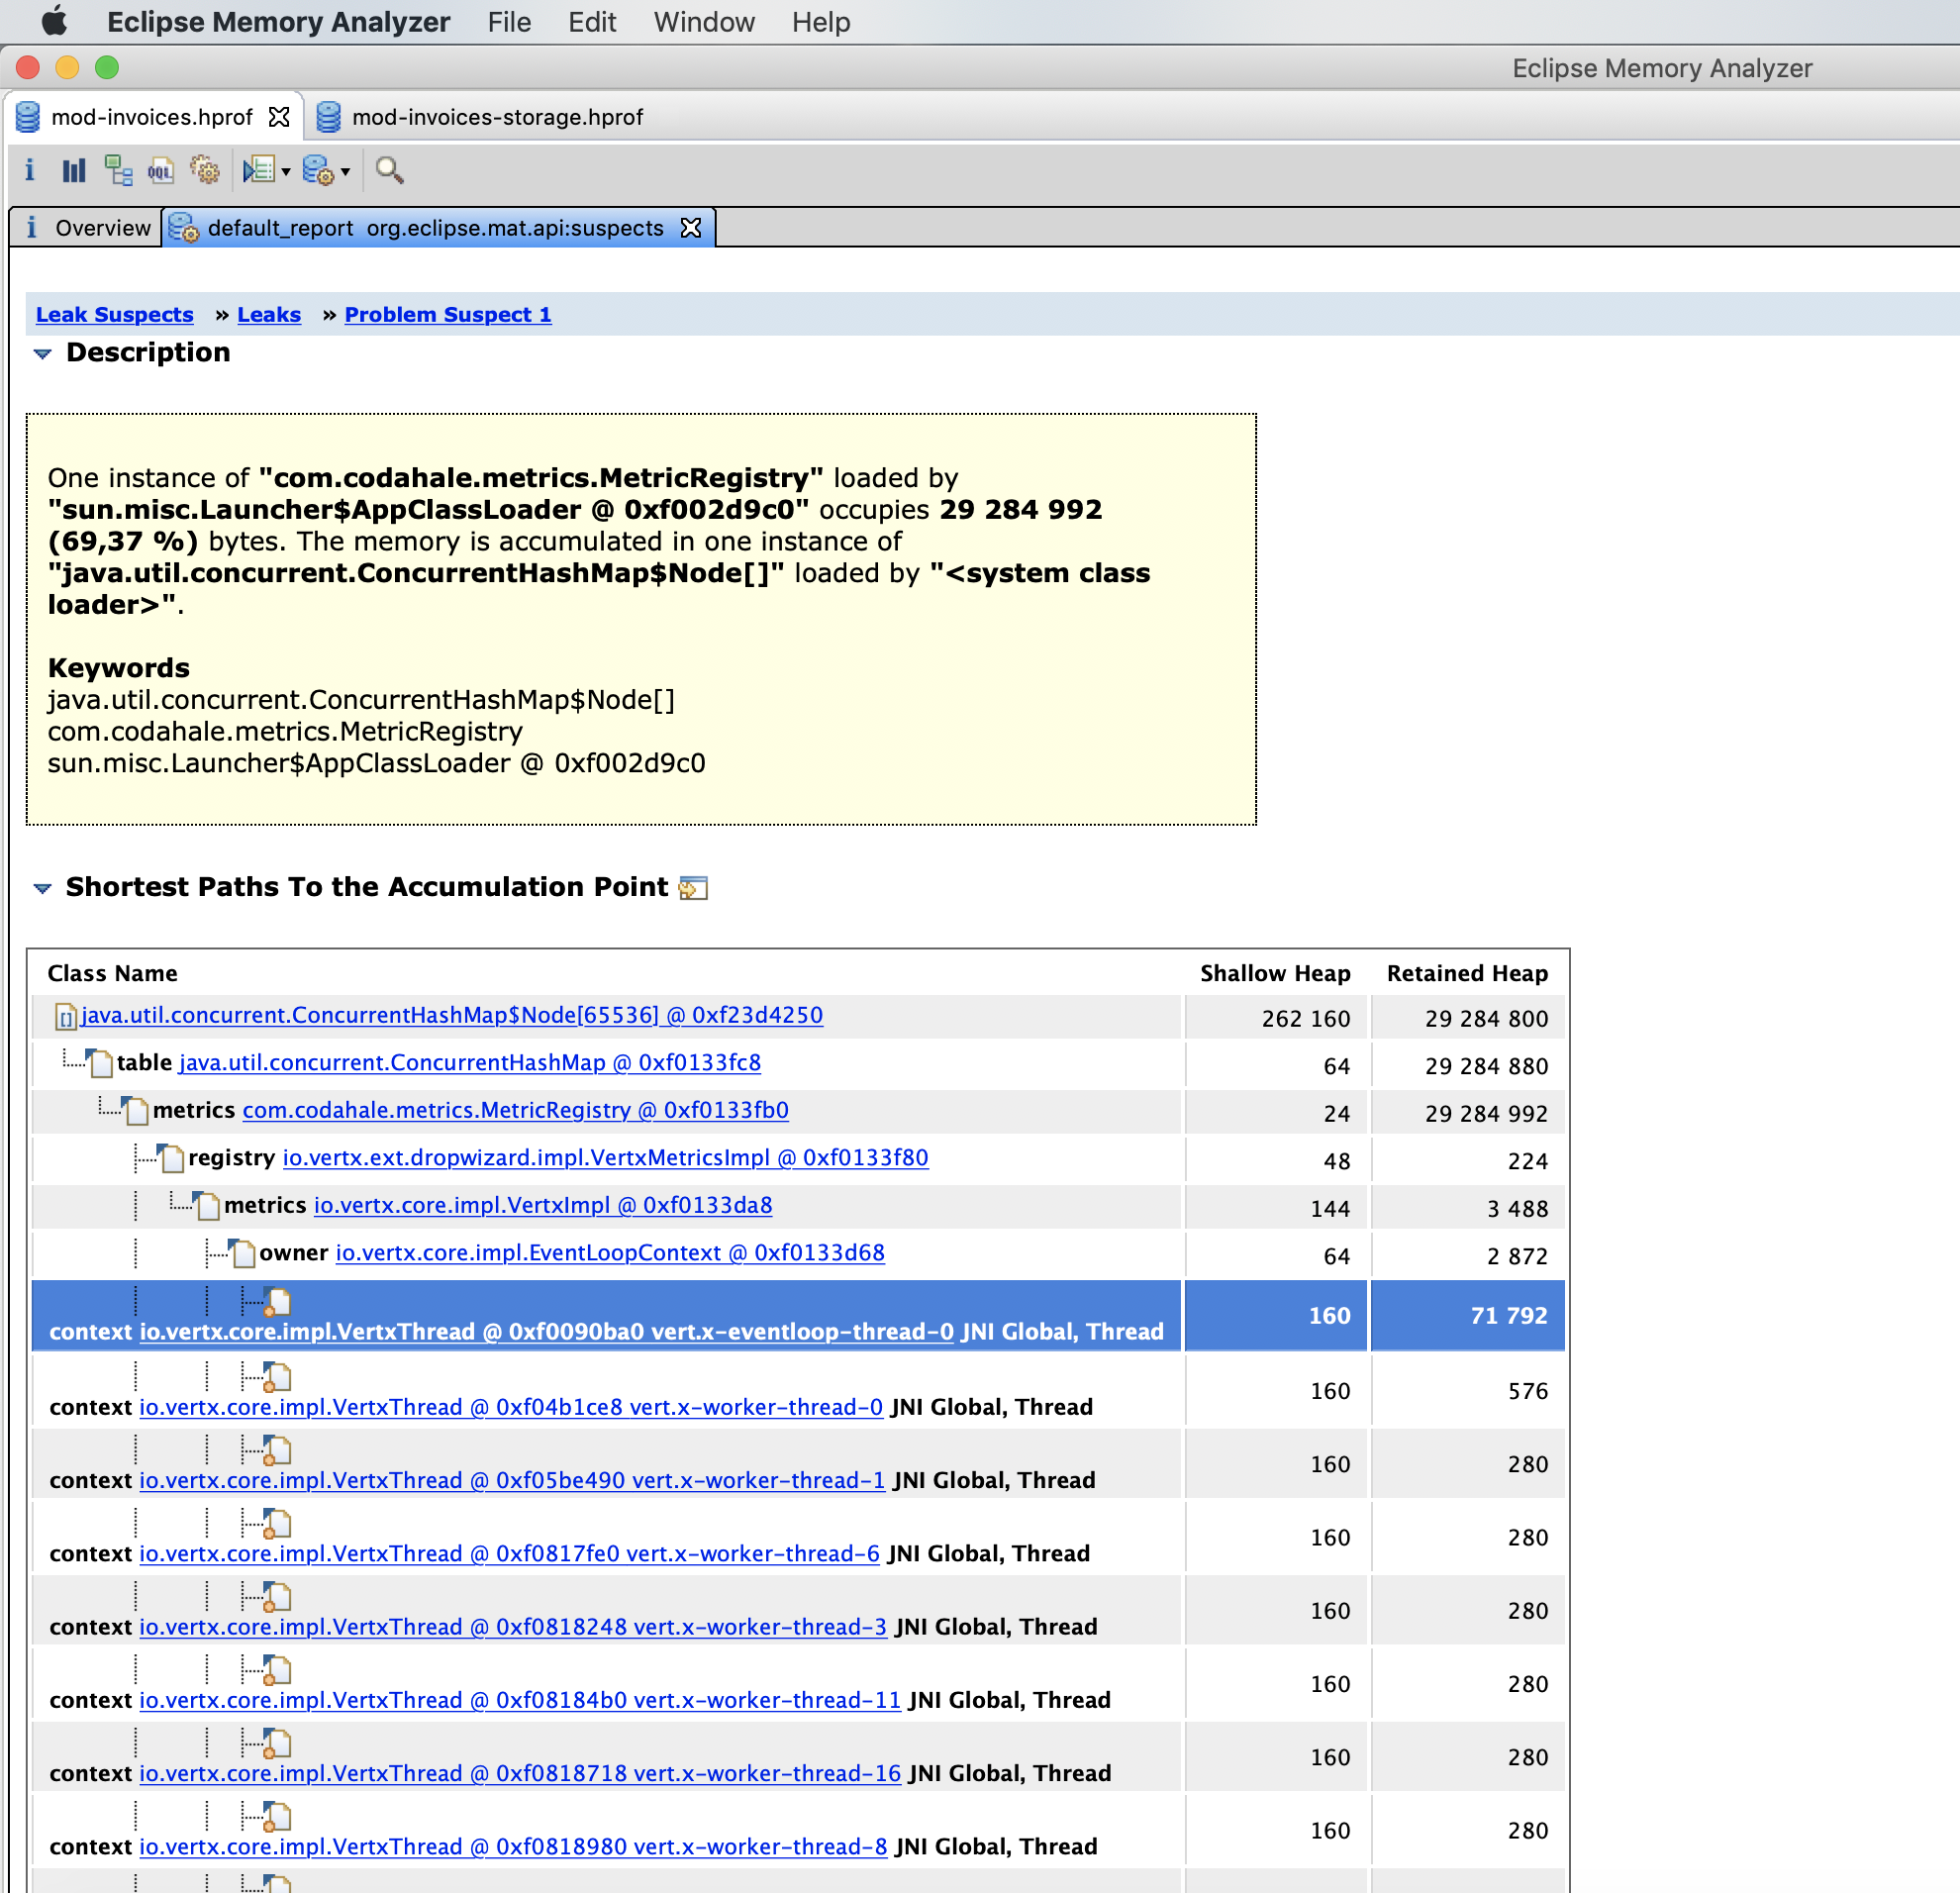
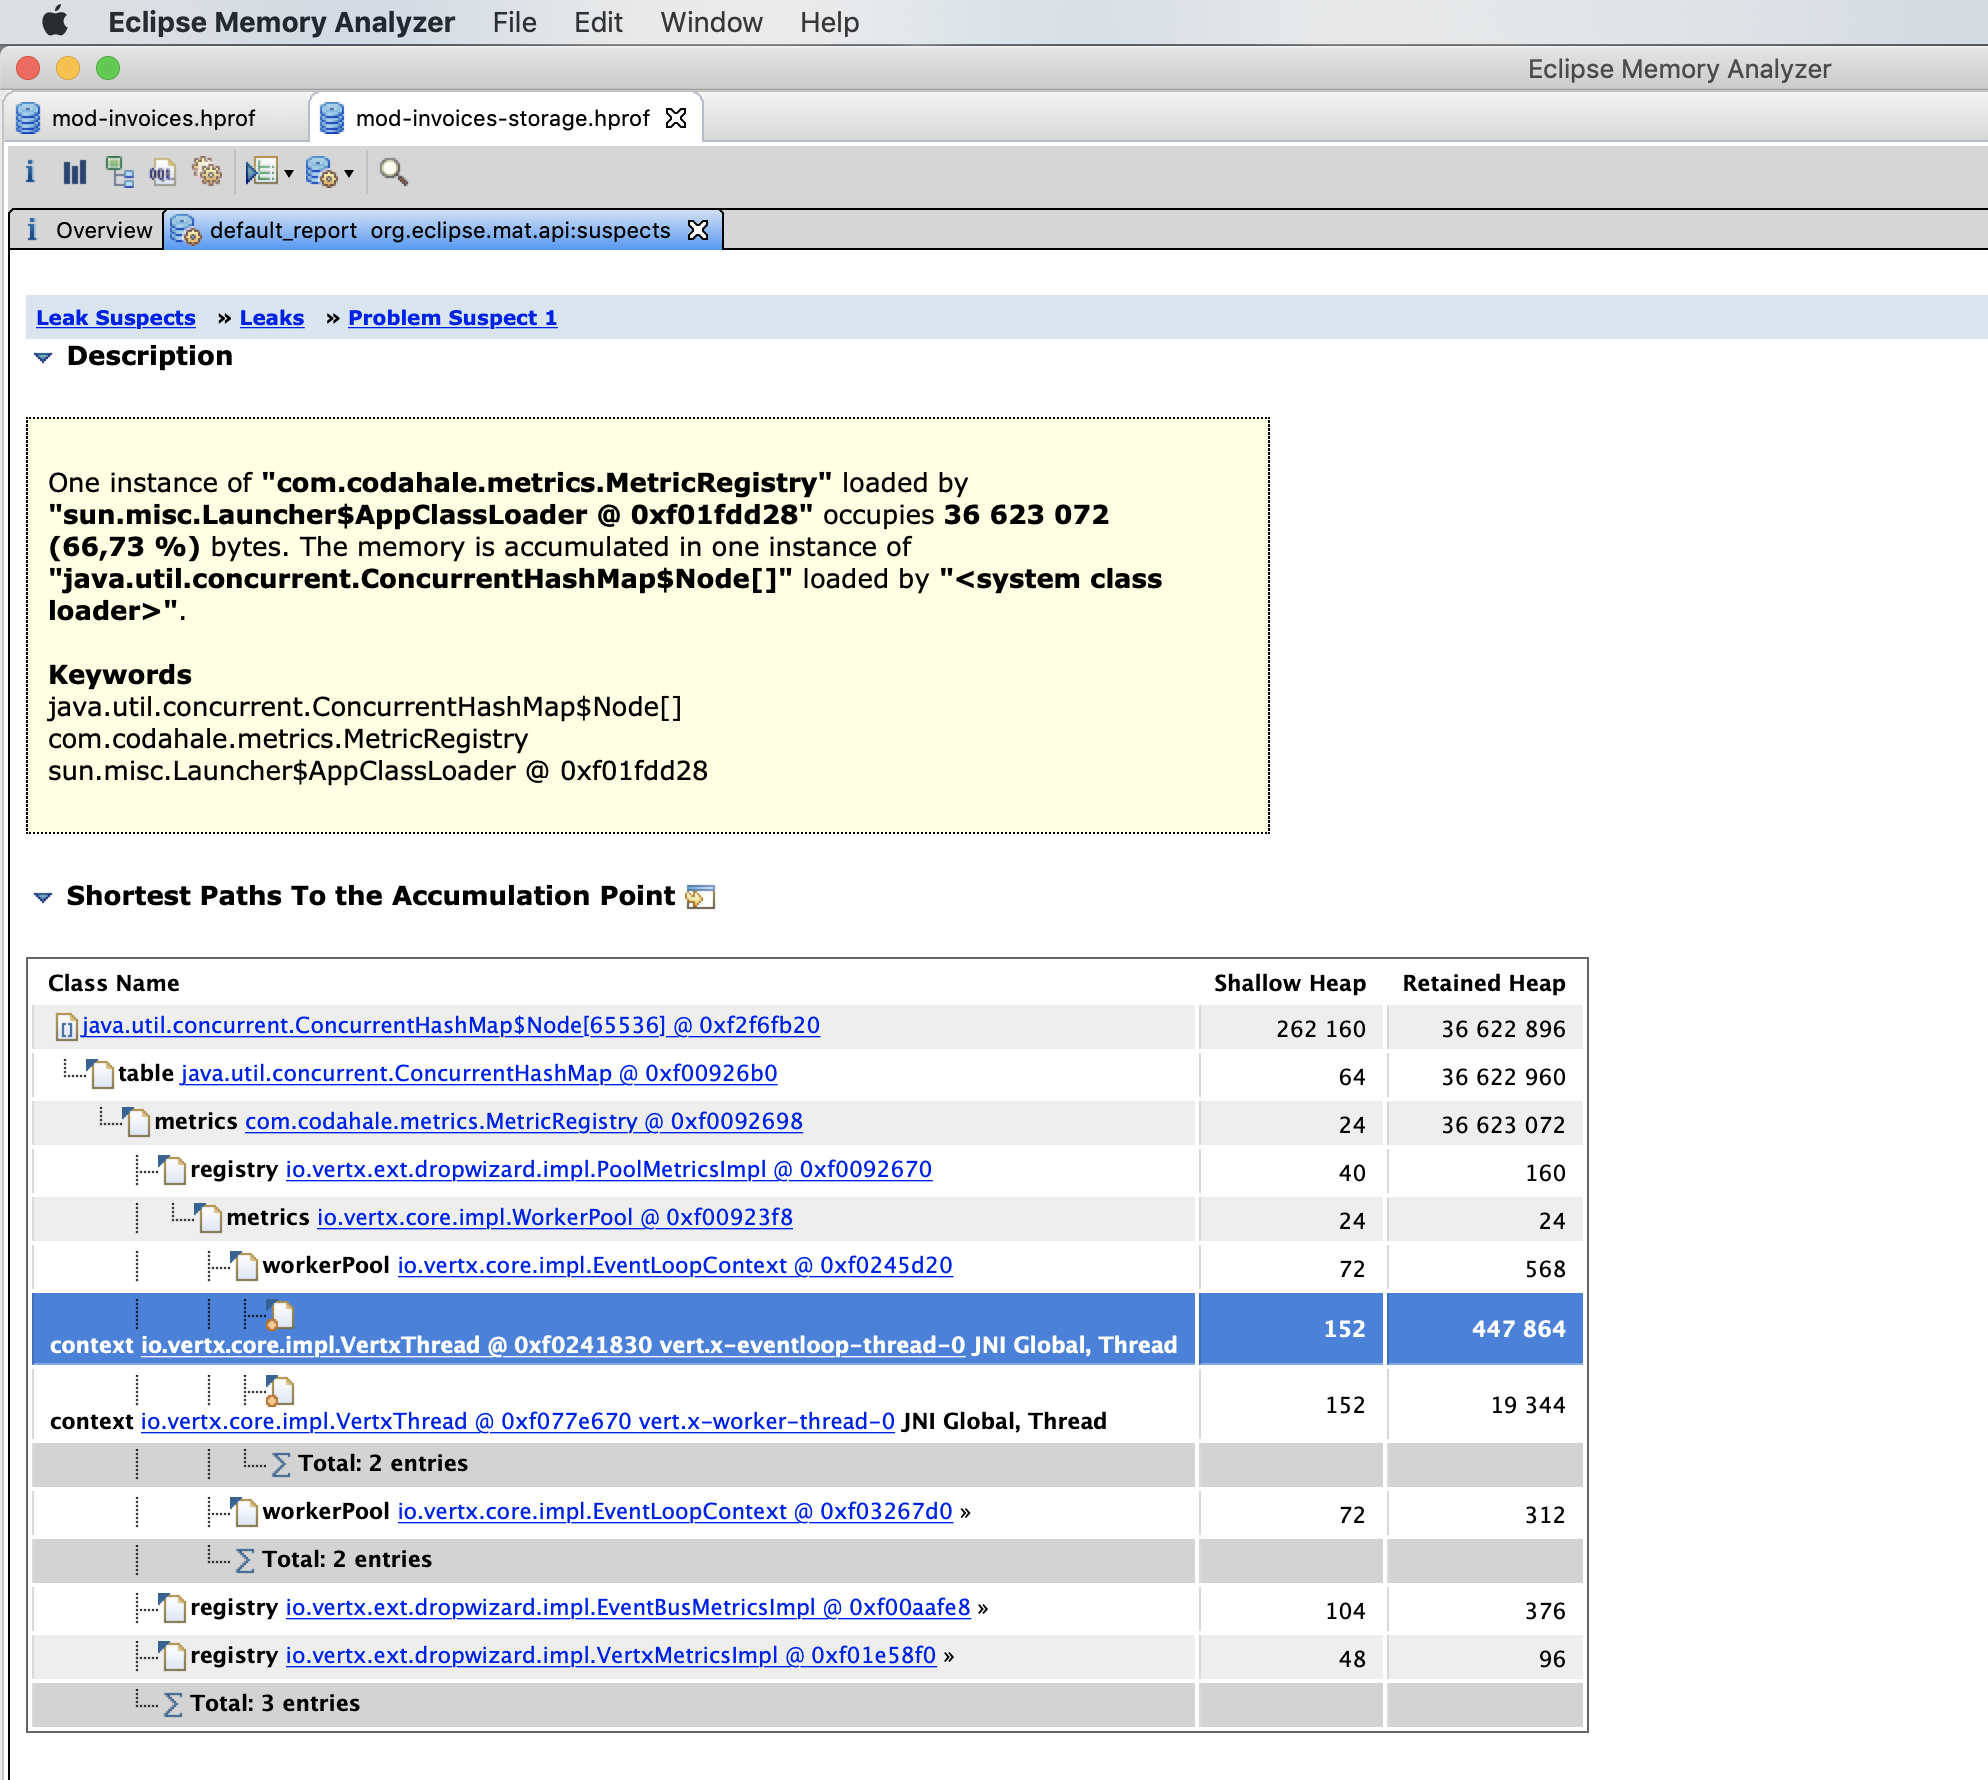
Heap dumps: mod-invoices.hprof, mod-invoices-storage.hprof.
Heap dumps analysis showed that problem relates to drop wizard metrics collecting.
After manual disabling of metrics collecting load test passes successfully with the following CPU/Heap utilization during 4 hours:
mod-invoice
mod-invoice-storage
Heap dumps analysis showed that issue was fixed.
Summary
Disable Dropwizard metrics on production environment.


